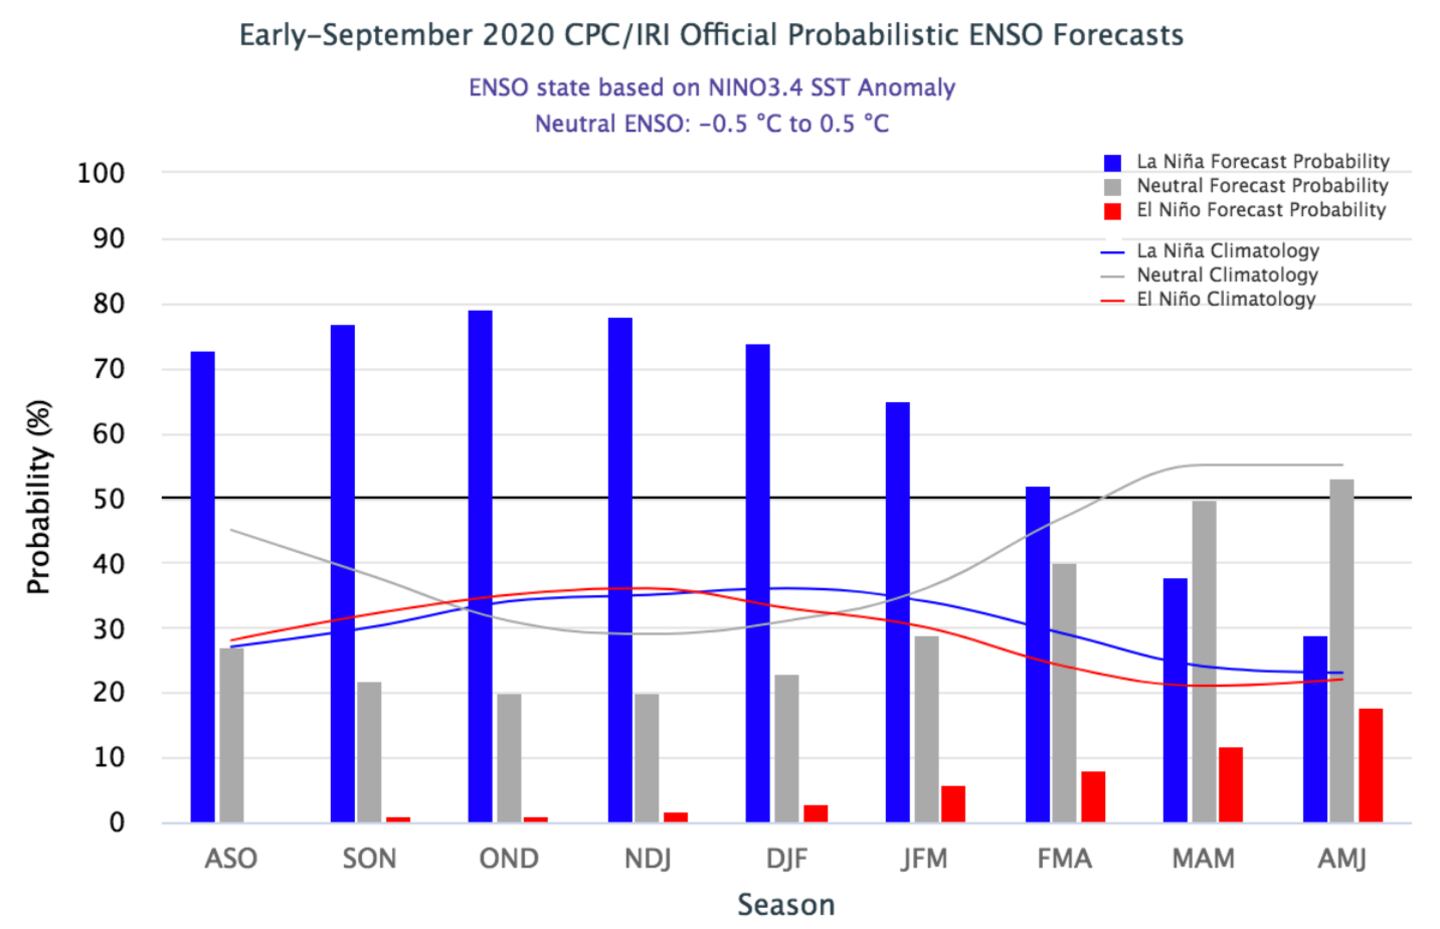
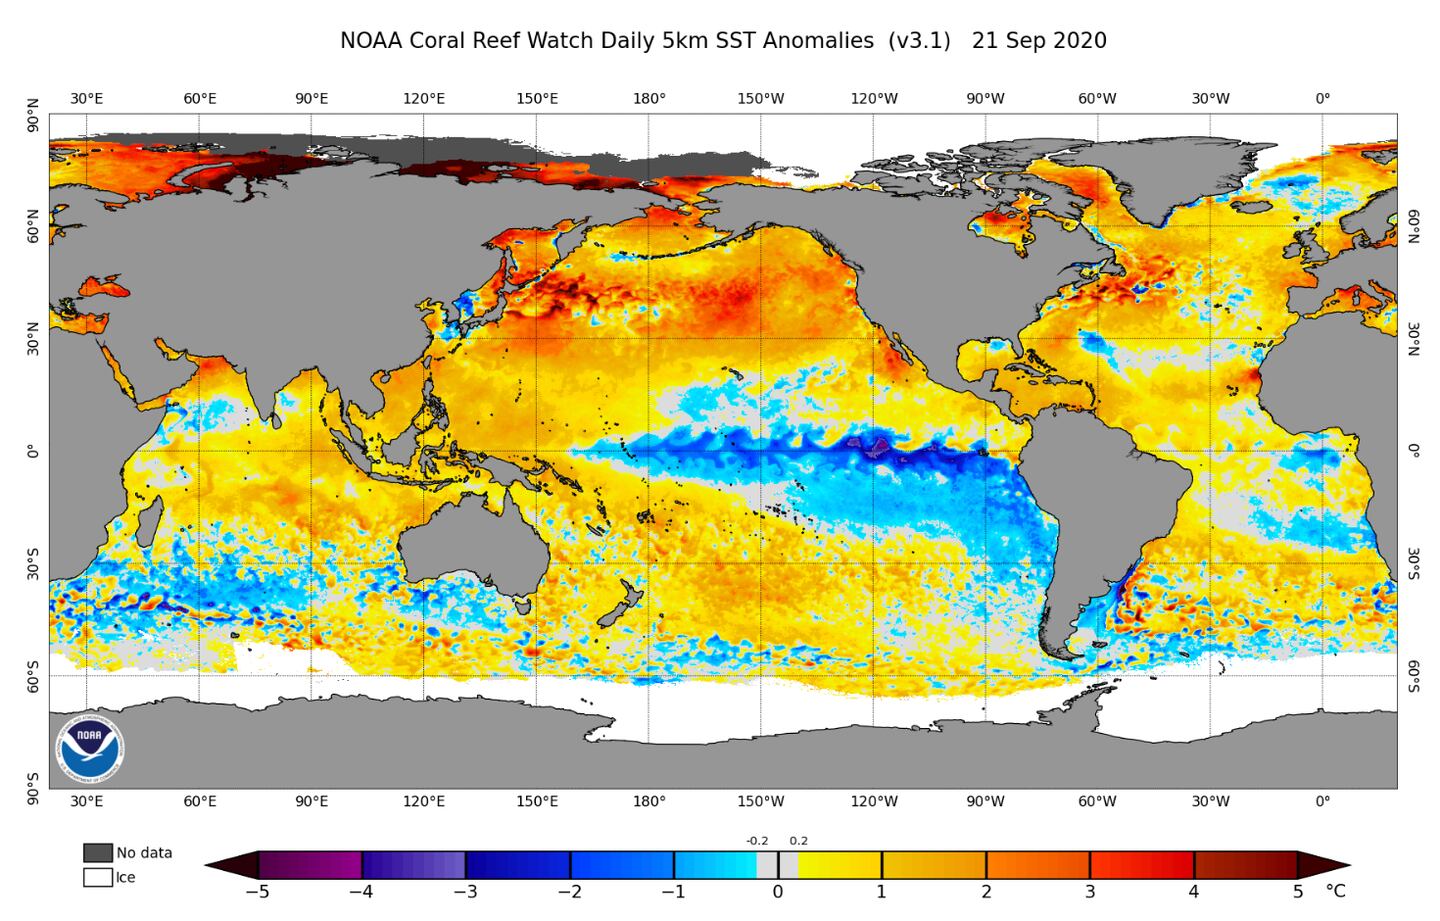
The La Nina blue cool streak in the Pacific from South America to the Date Line is plain to see above.
There are dozens and dozens of factors in the global atmosphere, oceans, stratosphere, and sun that impact what kind of winter we get, NOT just La Nina.
All factors will be examined when I issue my winter forecast by the end of October with an update if necessary by the start of December.
For now let’s just look at La Nina. Remember no two La Nina winters are ever exactly alike.
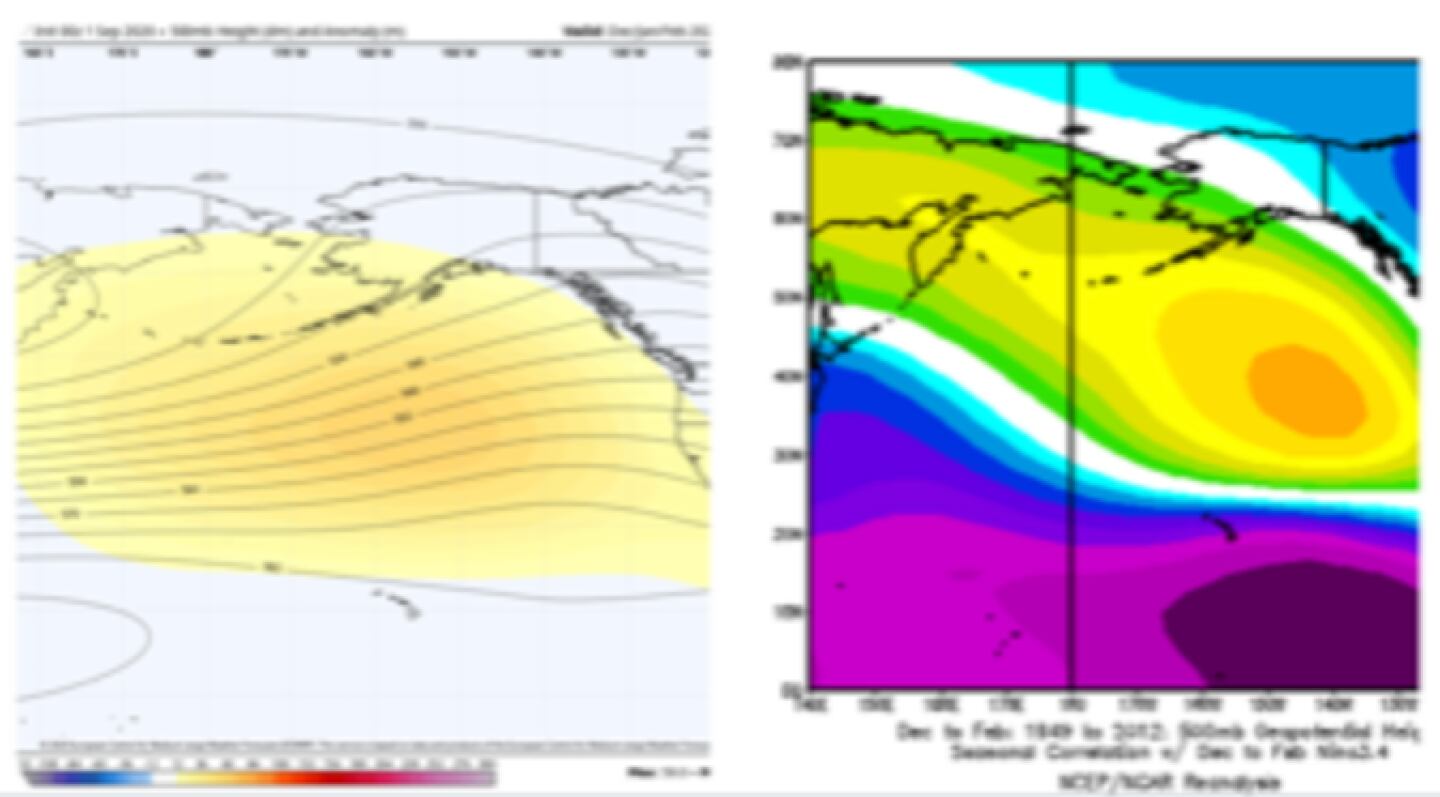
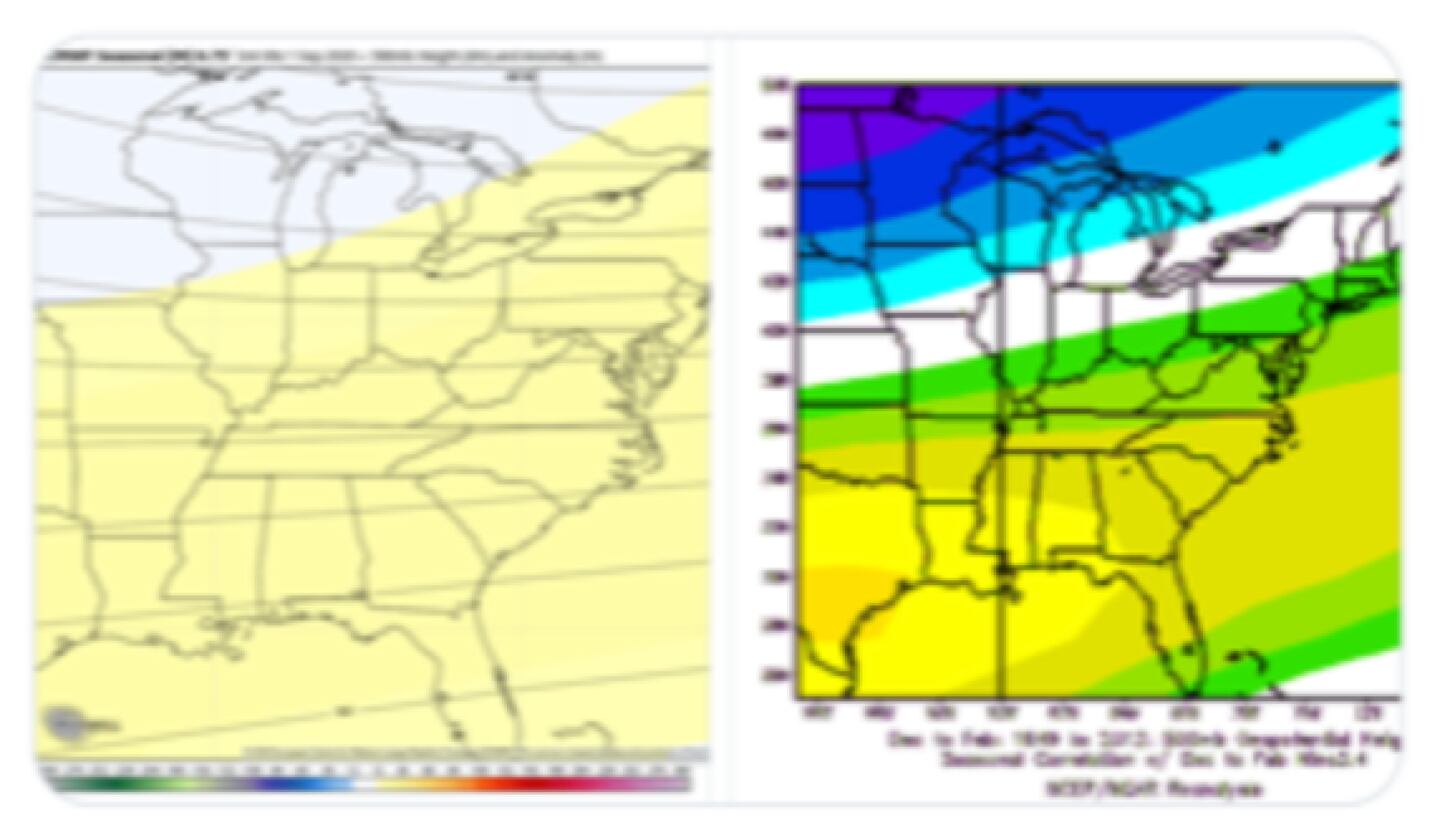
Typically a La Nina would feature mean upper level ridge North of Hawaii into Aleutian Islands/Gulf of Alaska:
And also mean upper level ridge in the South/Southeast:
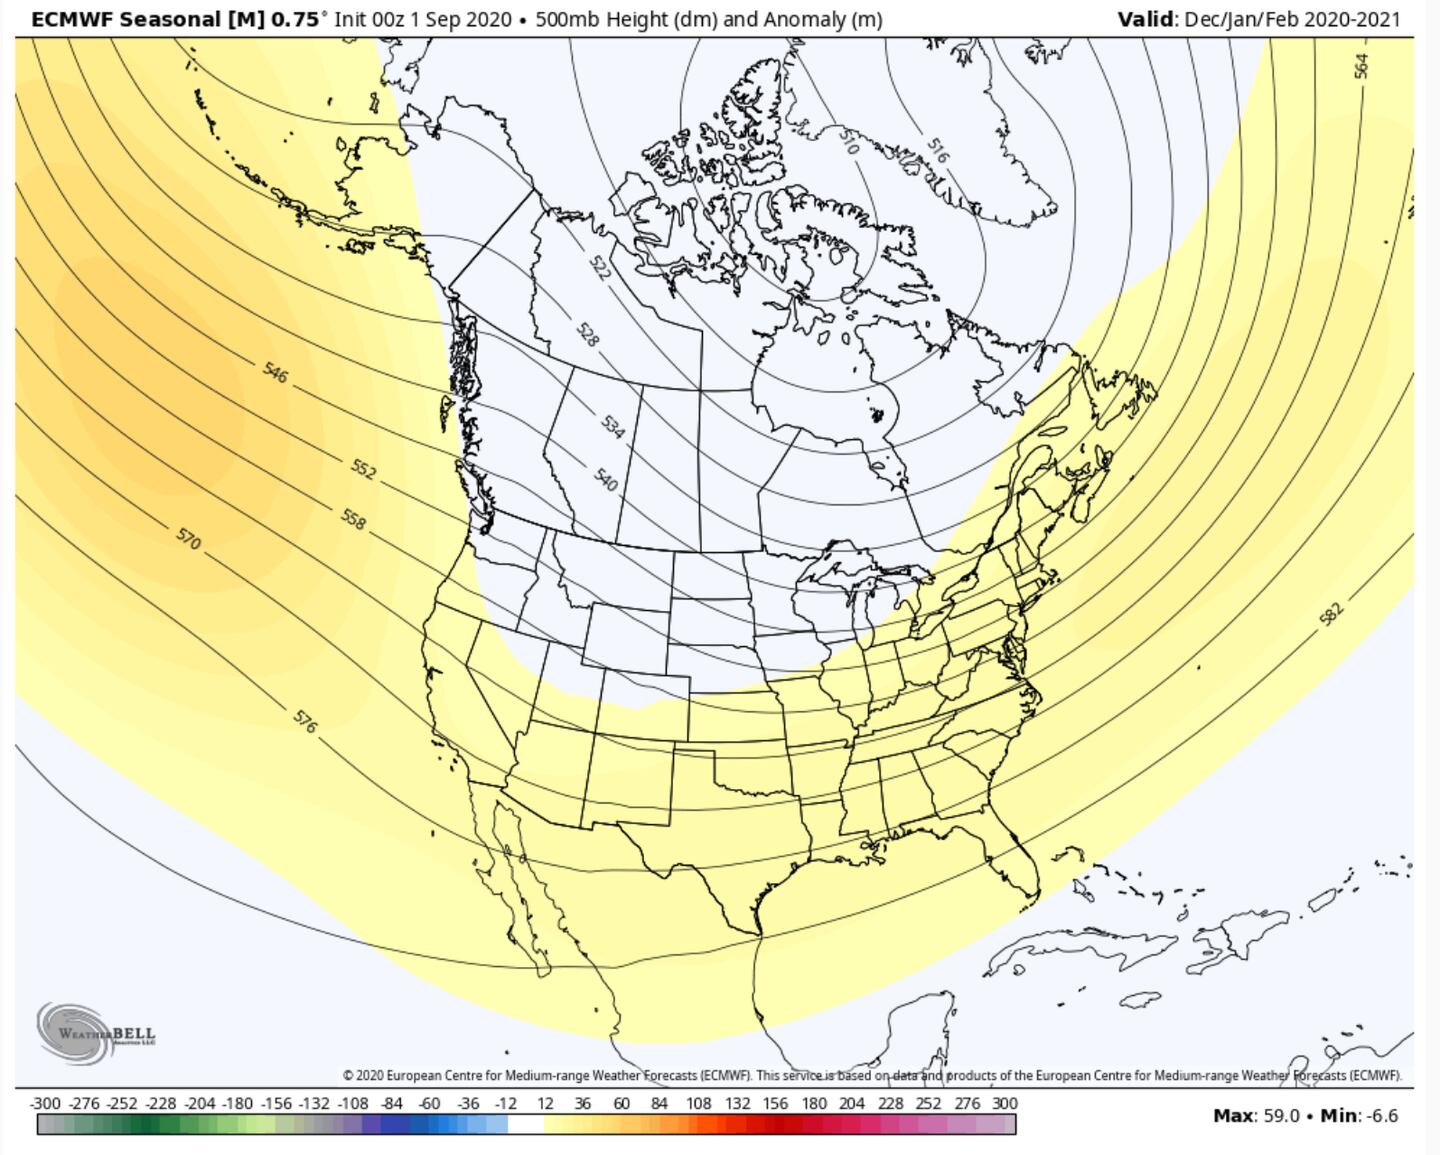
The ECMWF model is showing this type La Nina pattern for this winter:
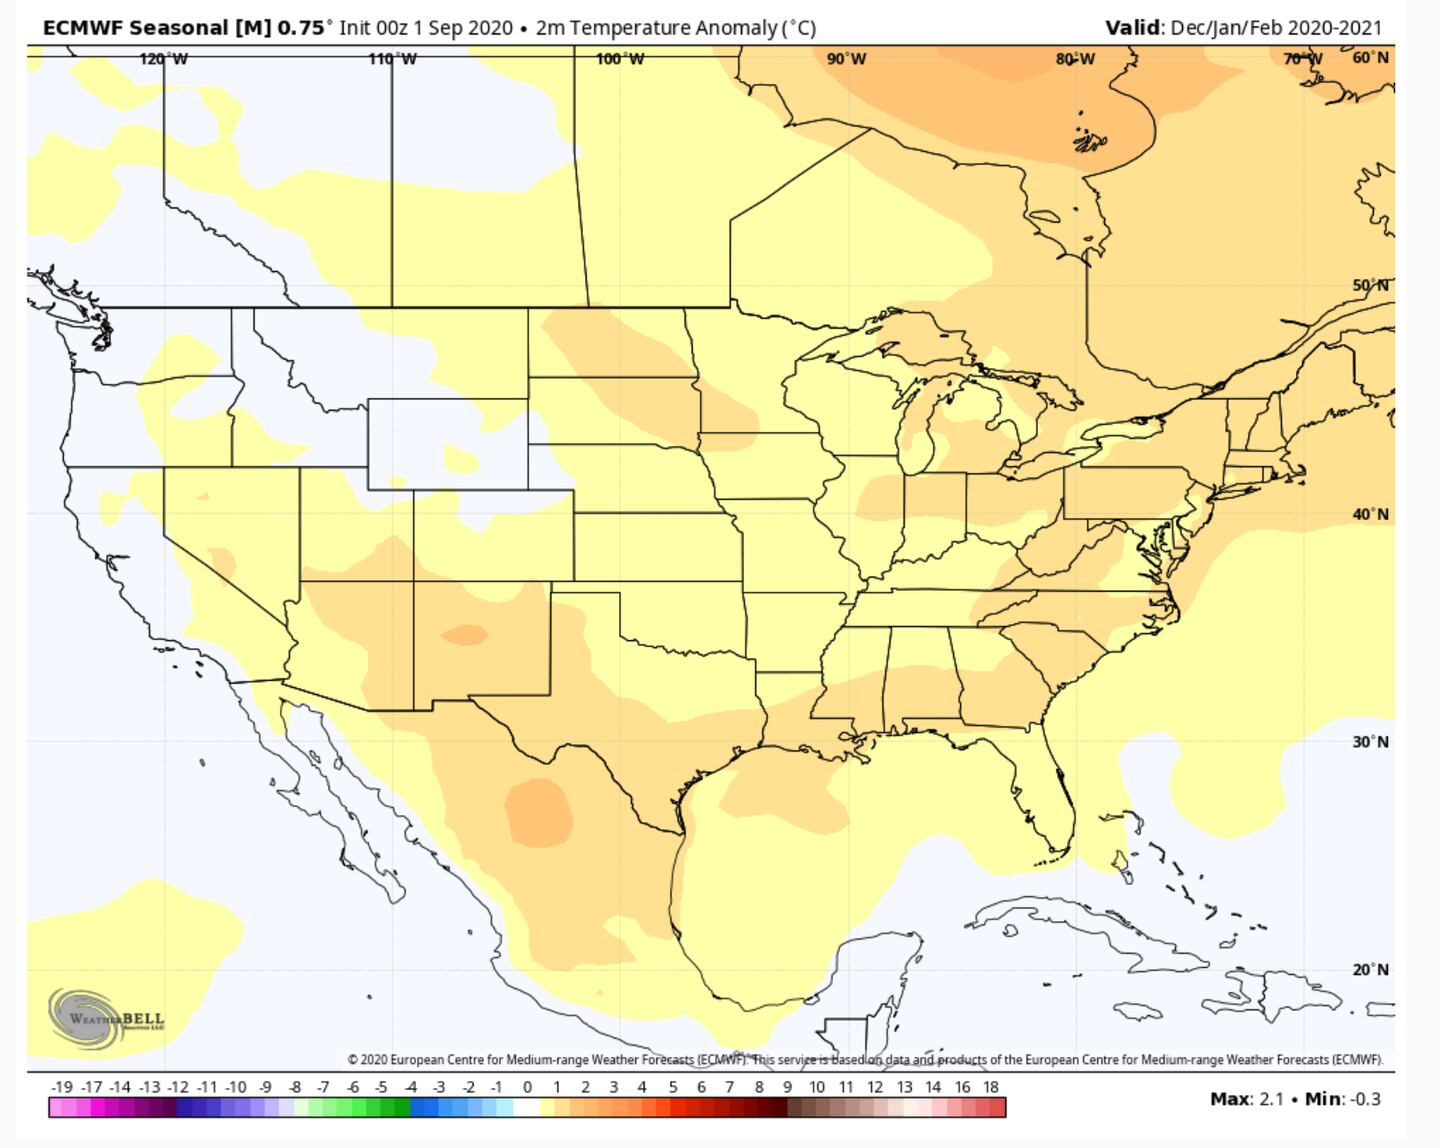
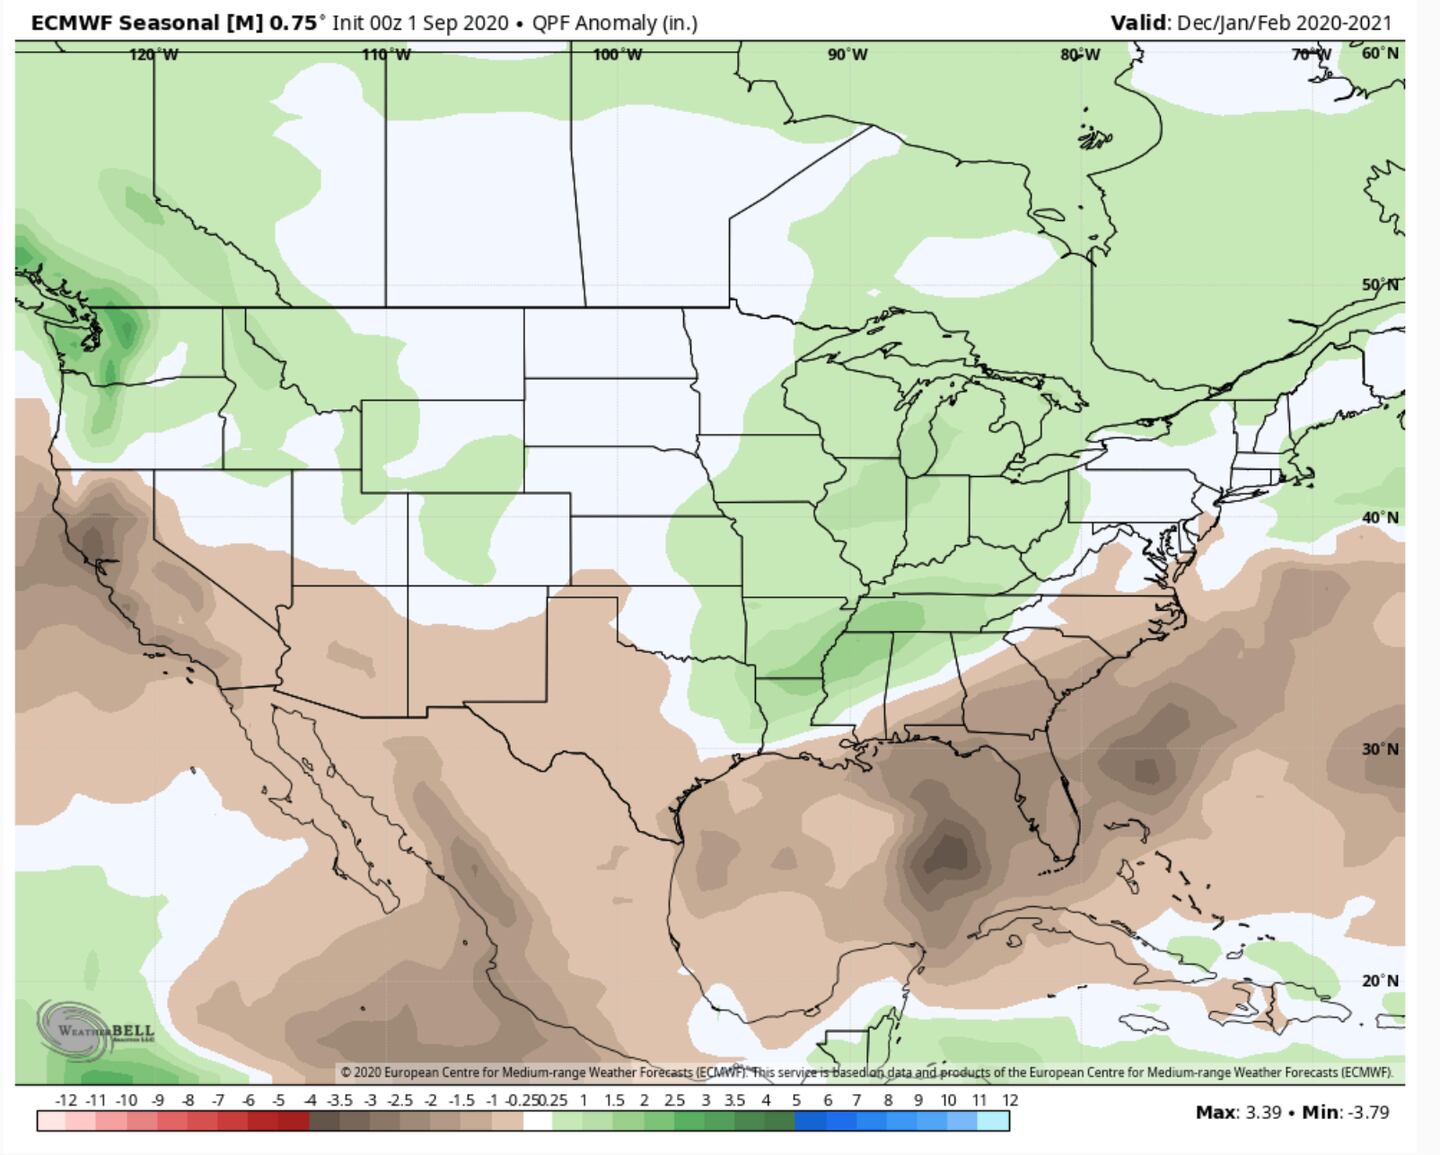
What that model shows as a result for temperature and precipitation departure from normal:
It is typical with a La Nina for the hurricane season to be more active than usual as we have seen this season, it also typically will prolong drought in California and reduce winter tornadoes in much of the South compared to average.
The La Nina is currently WEAK and their is considerable debate among ENSO experts on how strong it will be for the winter. If it stays weak its influence would be muted.
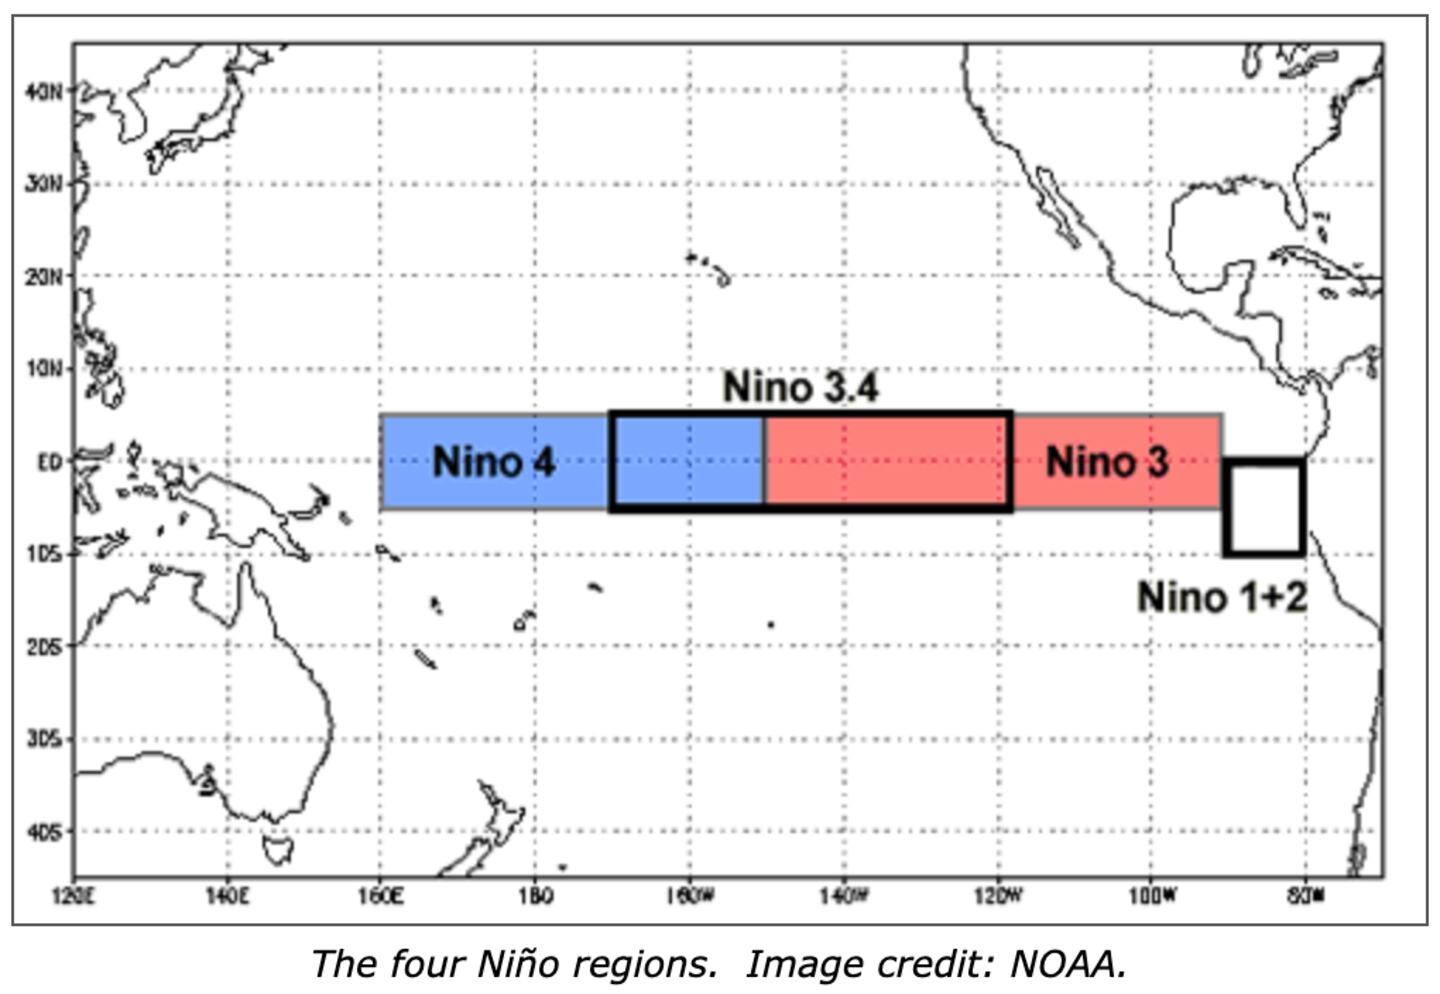
As I write this block most numerical equations point to a peak of La Nina in early to mid-December of -1 to -1.5C in the Nino 3.4 region. So I’ll use that for illustrative purposes. Some experts have suggested a moderate to strong La Nina.
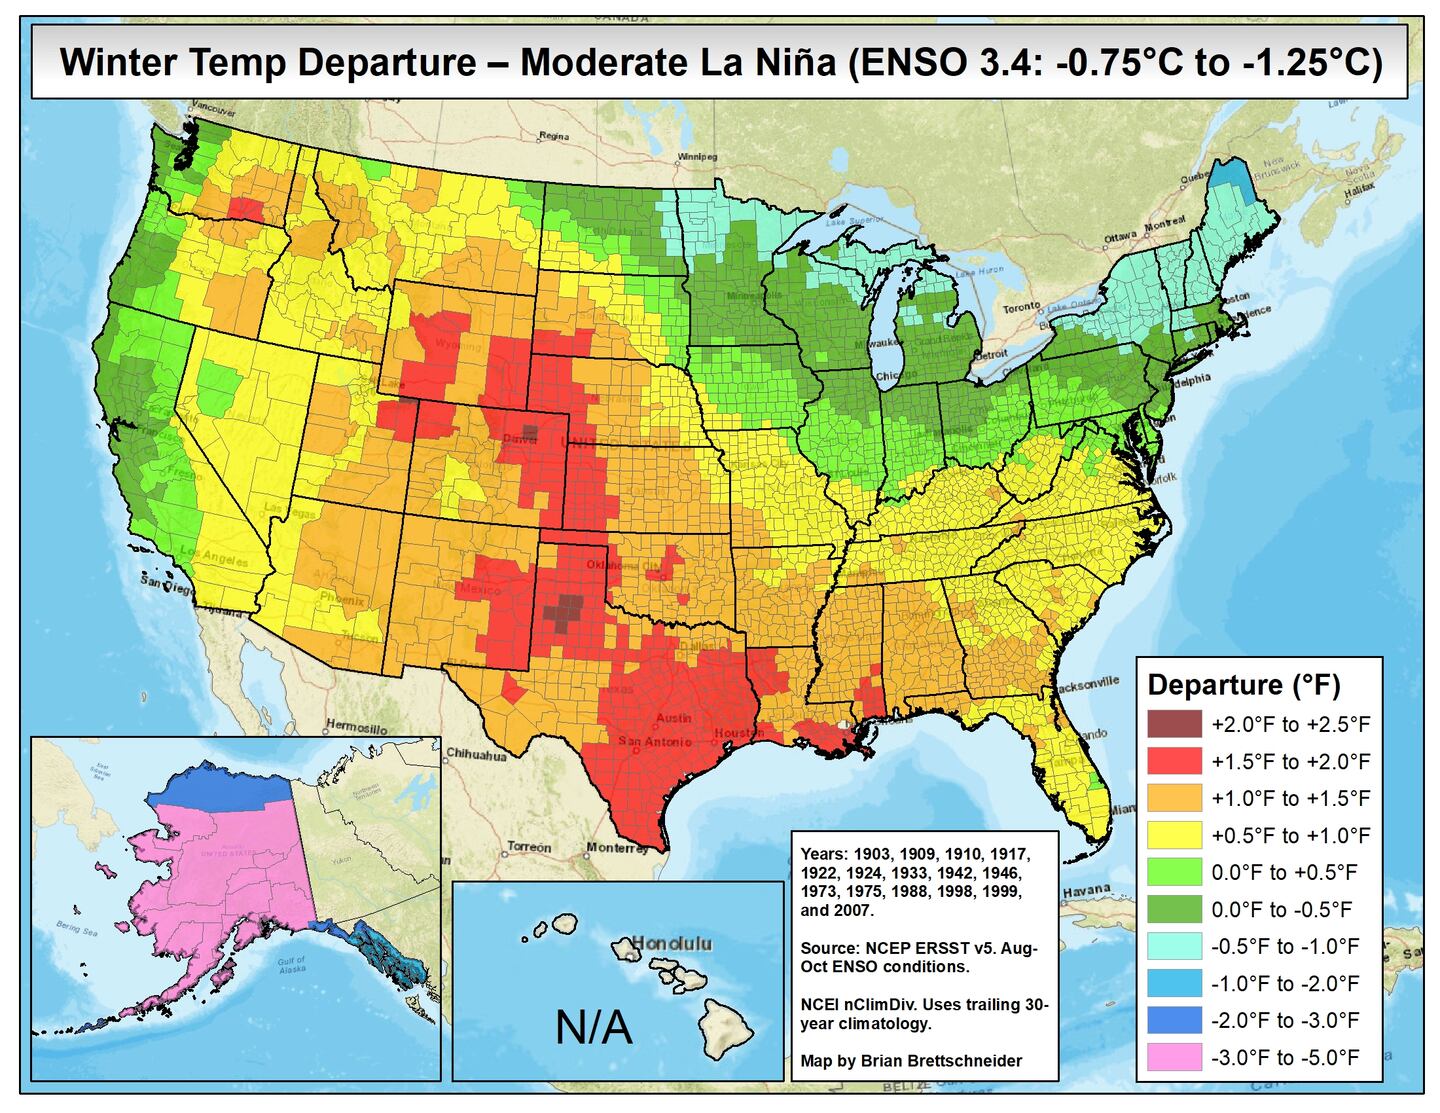
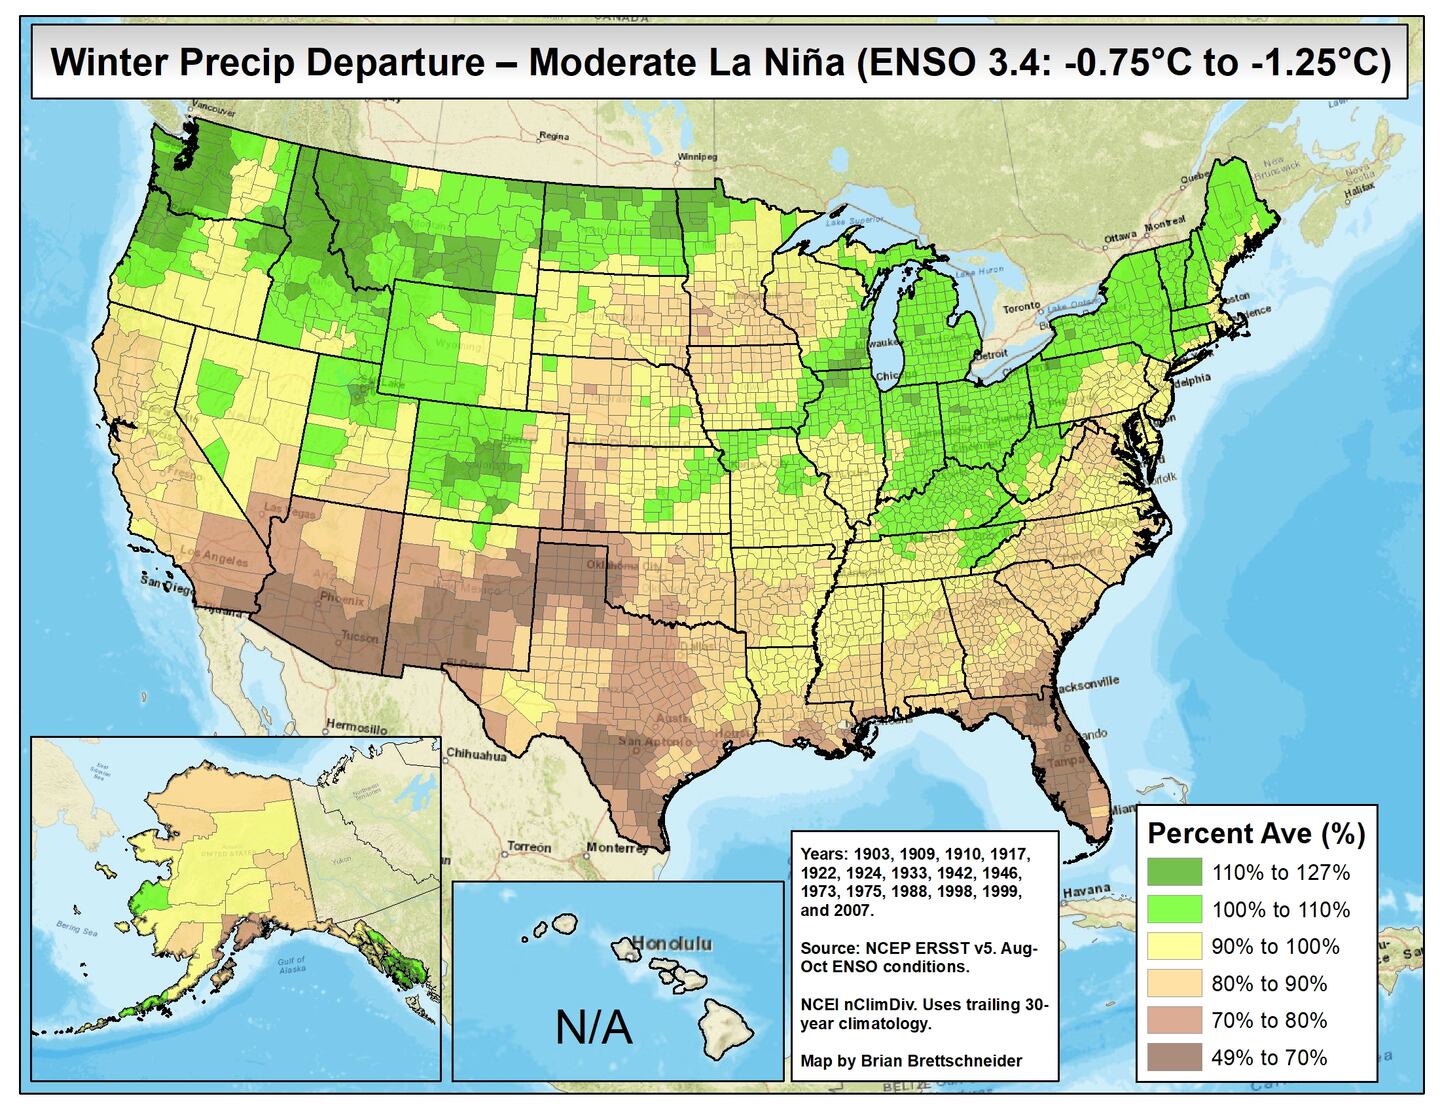
The following maps are based on 15 past 3.4 region moderate La Nina of -0.75 to -1.24C during December-February:
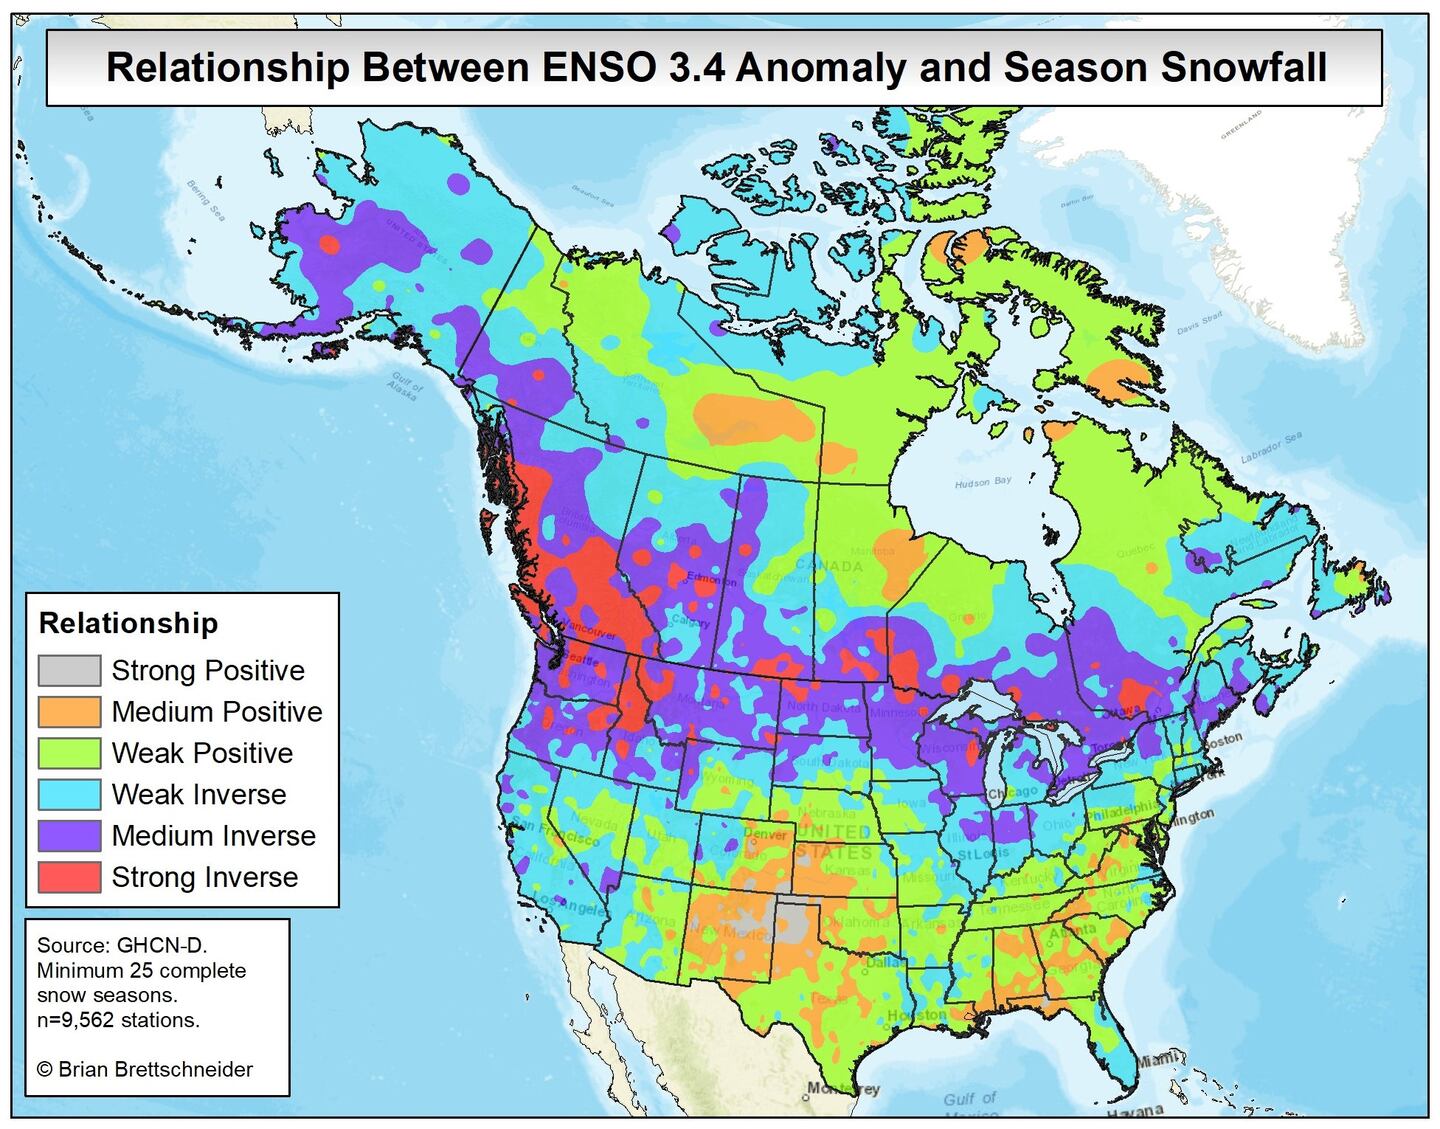
The map below shows the relationship positive or inverse between ENSO status in the Fall versus the following winter’s snowfall. The higher than normal odds of snow are generally found near and North of I-80.
For our area it shows a weak positive relationship indicating lower than normal snow odds:
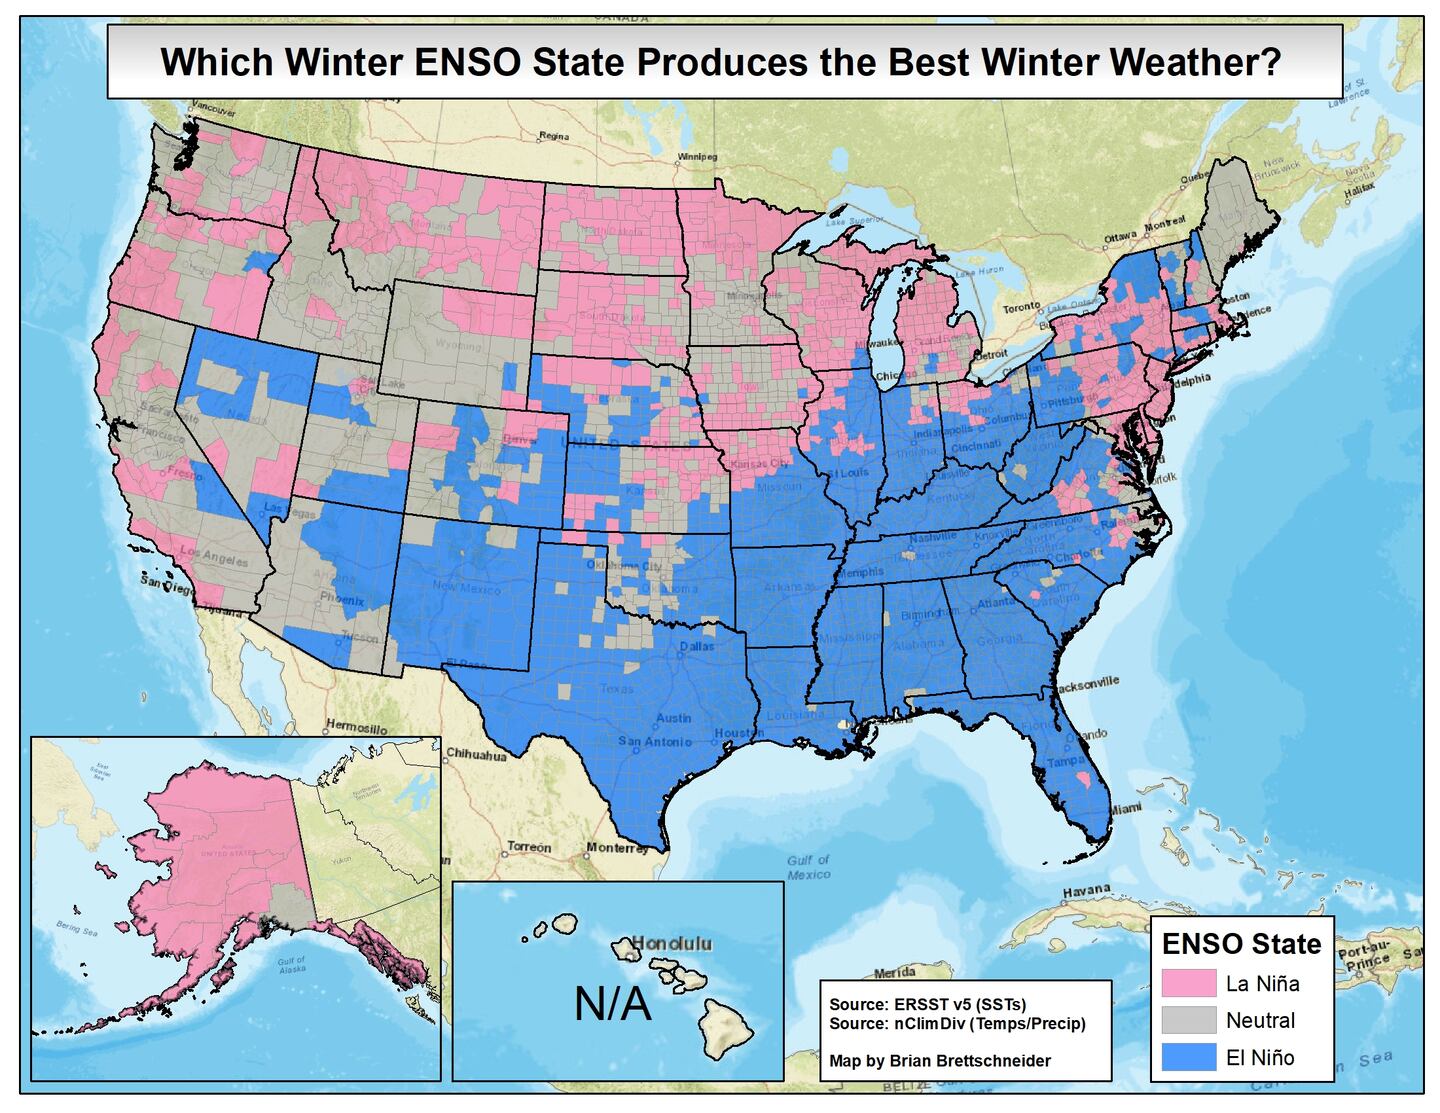
This map shows the relationship for the “Best” state of ENSO for winter weather lovers cold/snow:
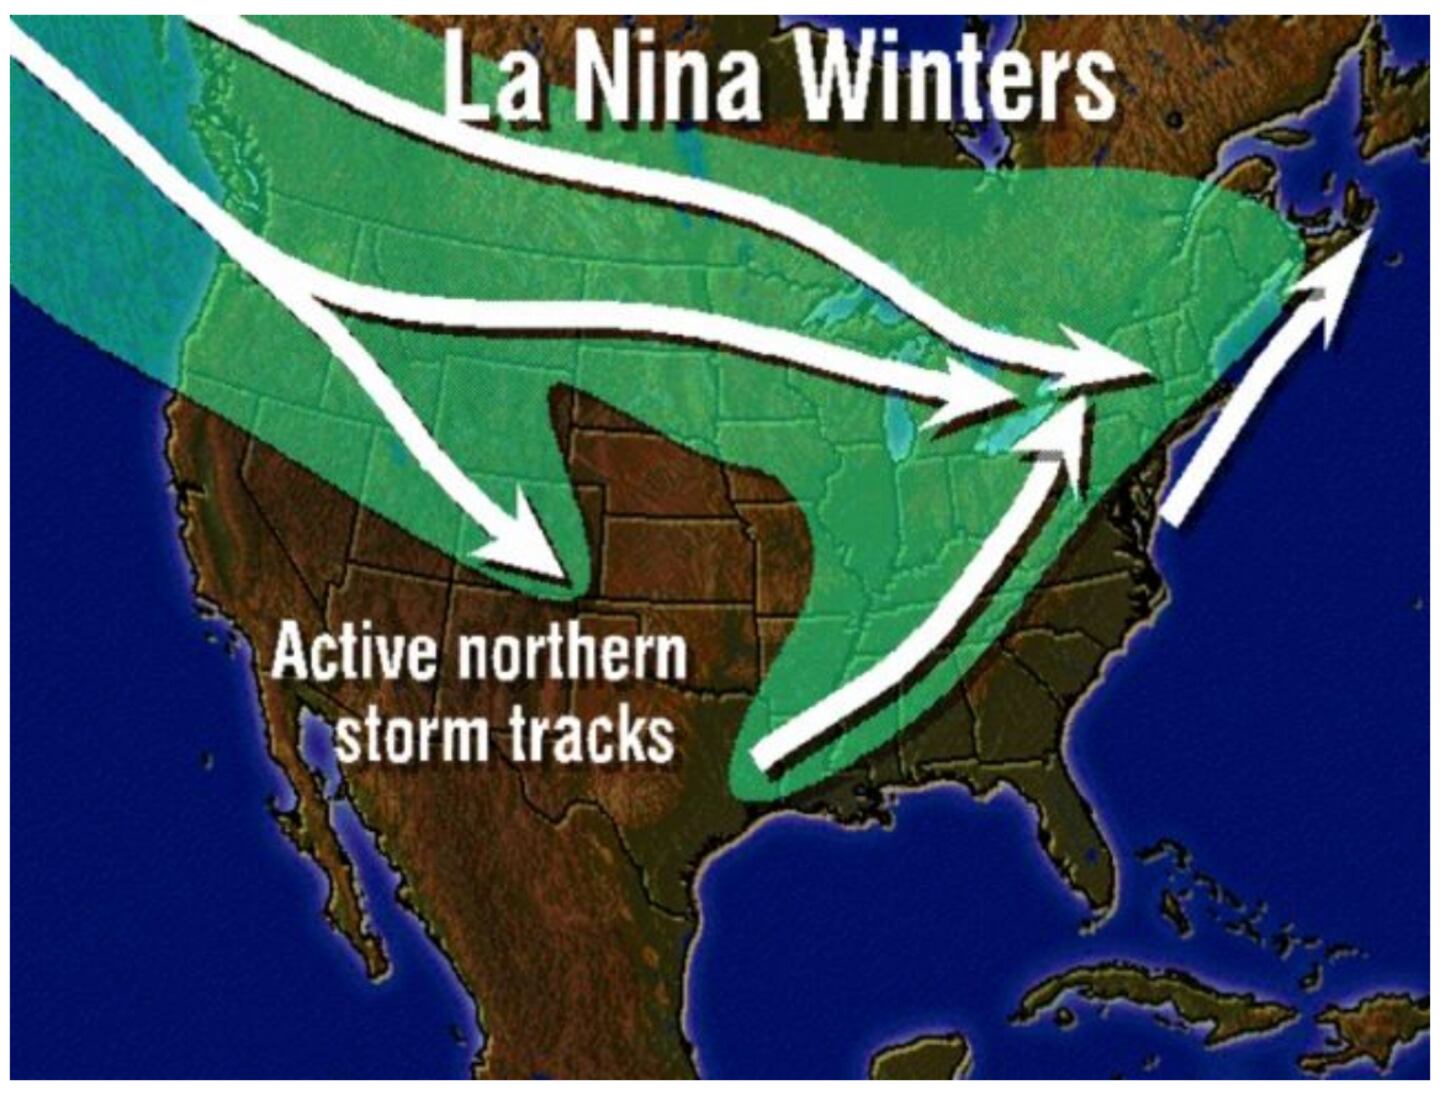
PREVAILING LA NINA WINTER STORM TRACKS WITH TROUGH CENTERED OVER CANADA:
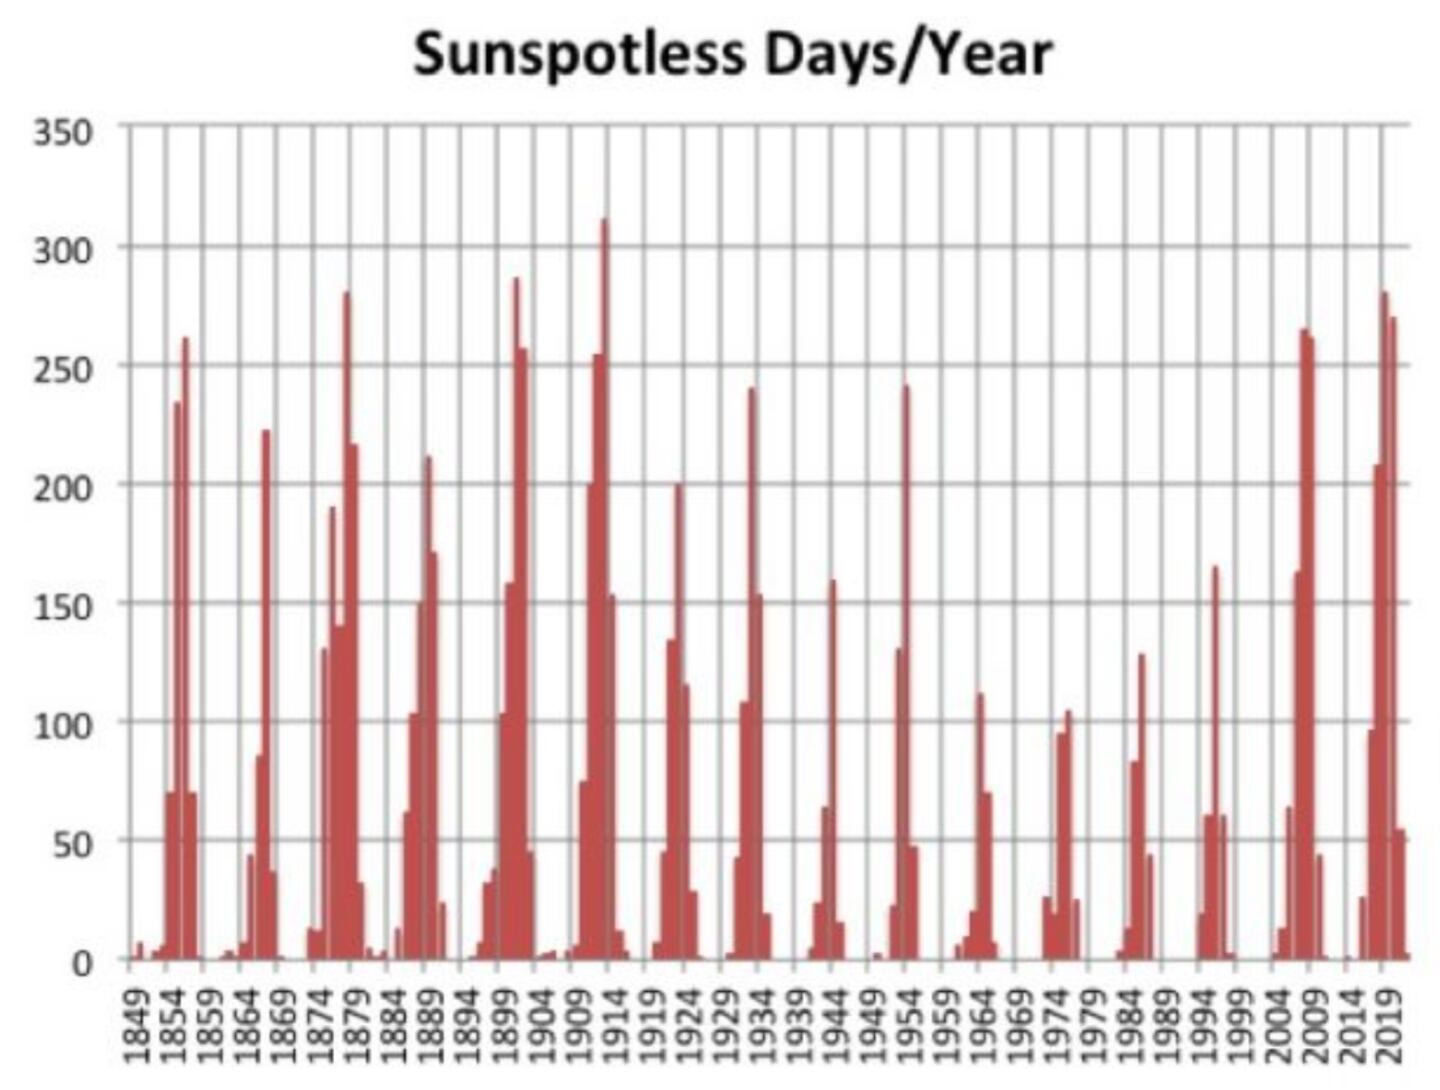
We are also in a LOW SOLAR period with few sunspots and have been for years now. This year we are also expected to be in a West or positive QBO state (wind direction in the stratosphere).
We can expand to consider what winter has looked like in the past when there was a low solar cycle, +QBO, and a La Nina.
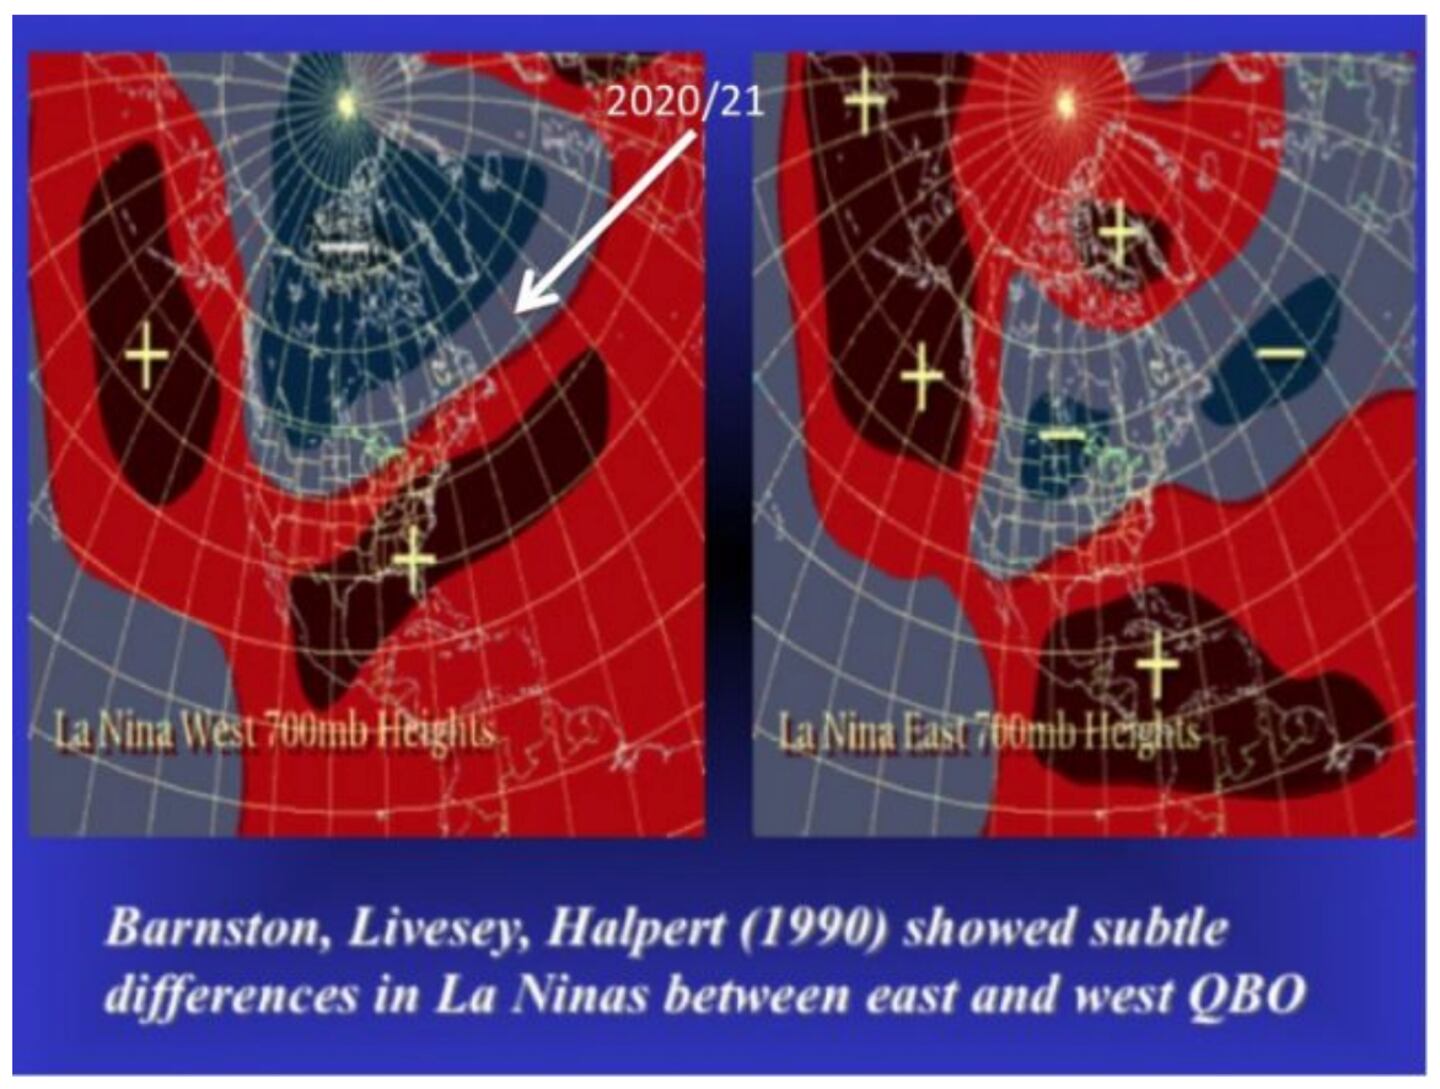
CPC correlation of 700/500mb winter jet stream height pattern in a La Nina with West+QBO:
You see in left-hand panel above the trough in Canada and a ridge in the Gulf of Alaska and over the Southeast U.S.
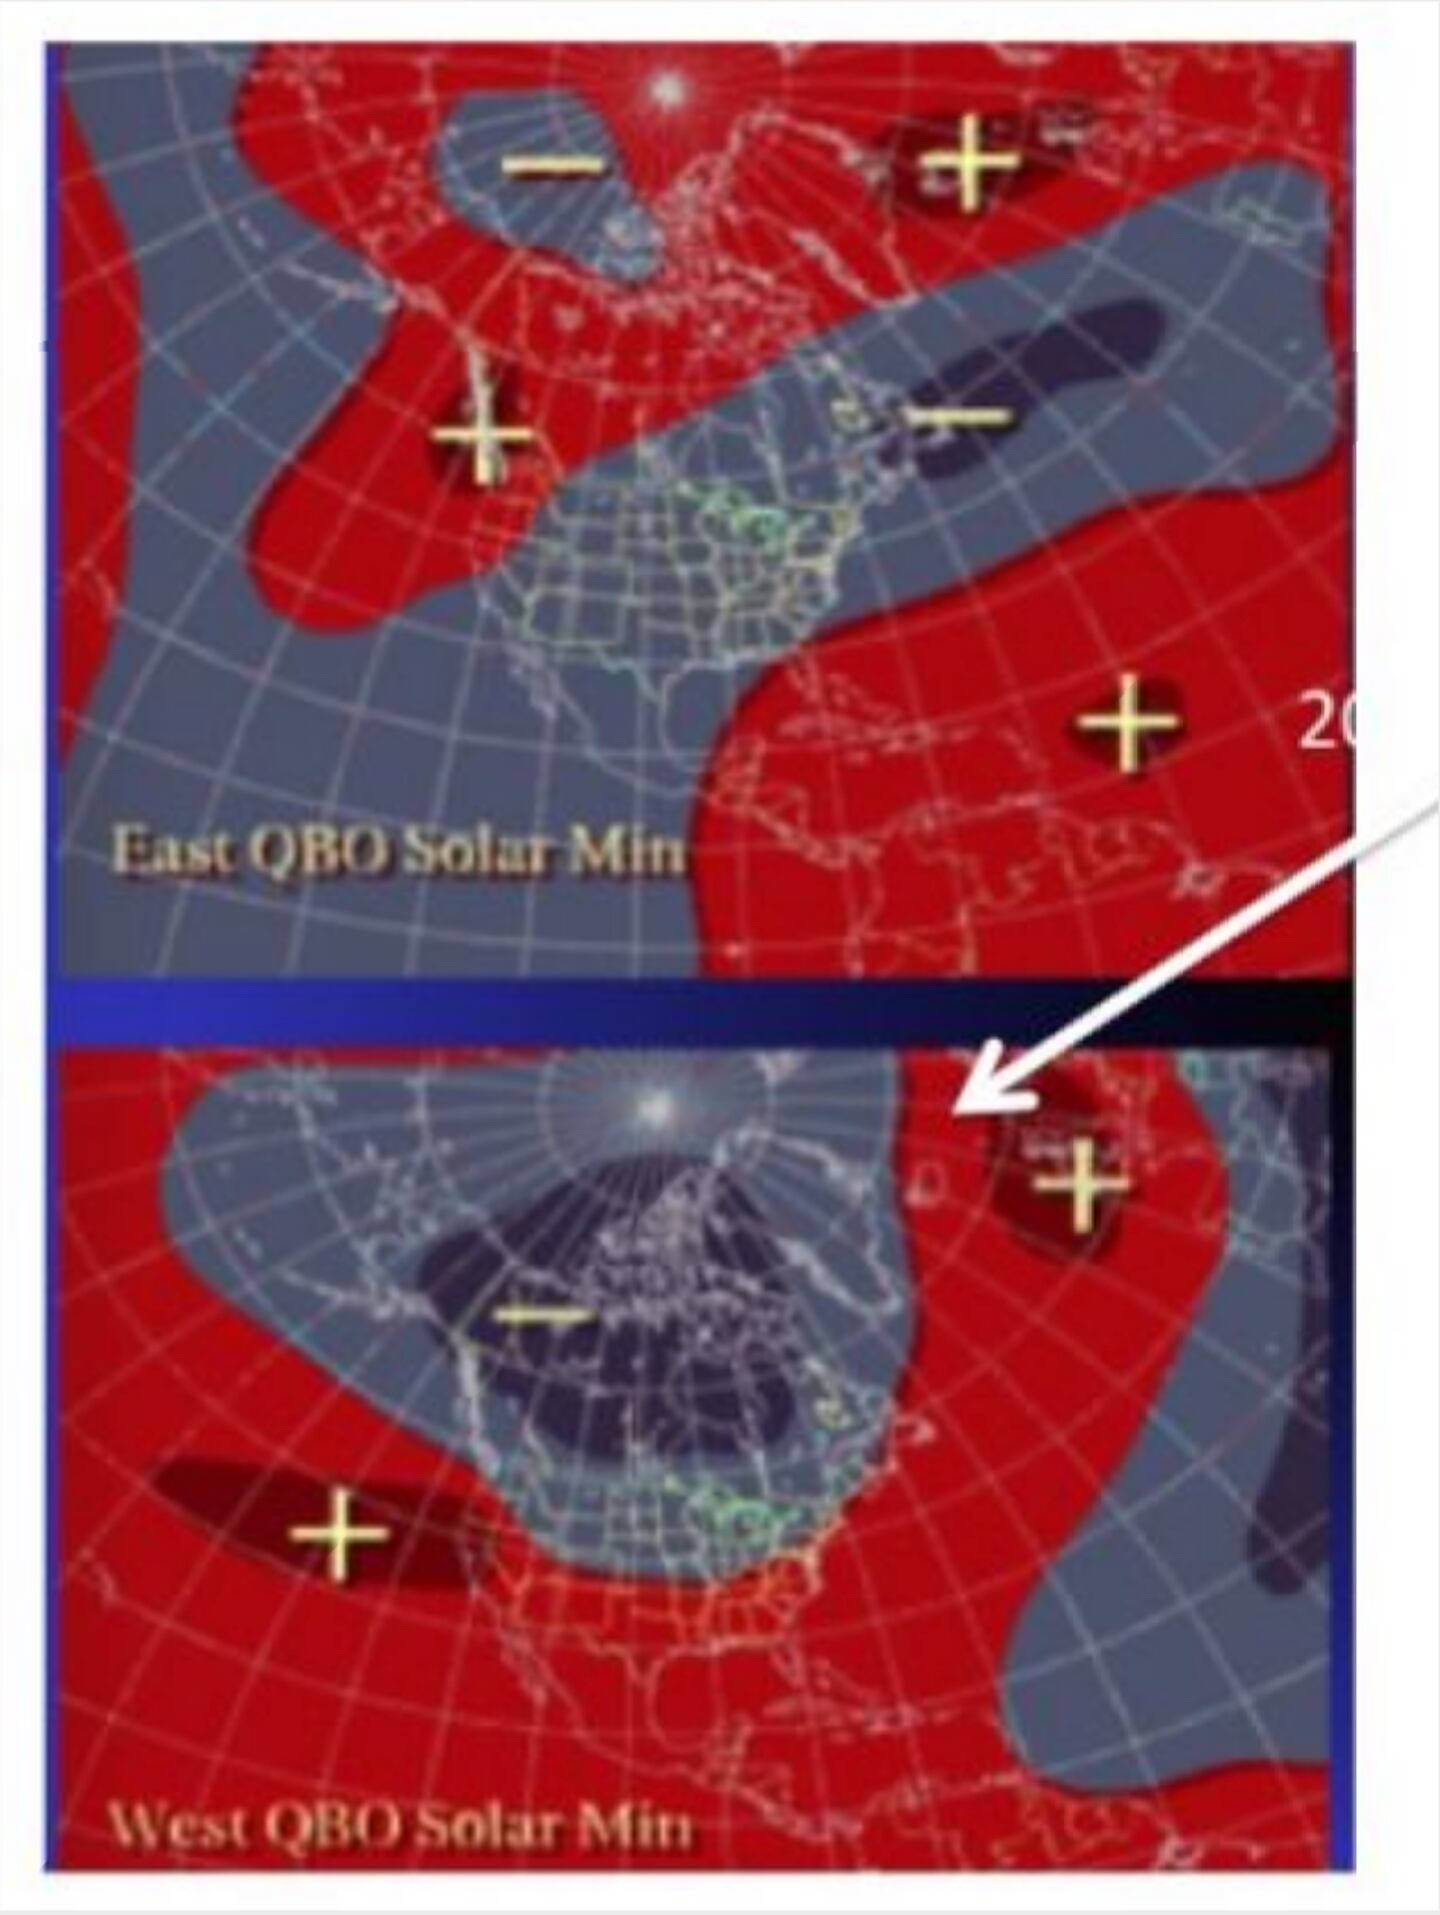
CORRELATION BETWEEN +QBO AND LOW SOLAR CYCLE:
You can see above similar pattern but the Gulf of Alaska is a trough and the Southeast ridge is weaker.
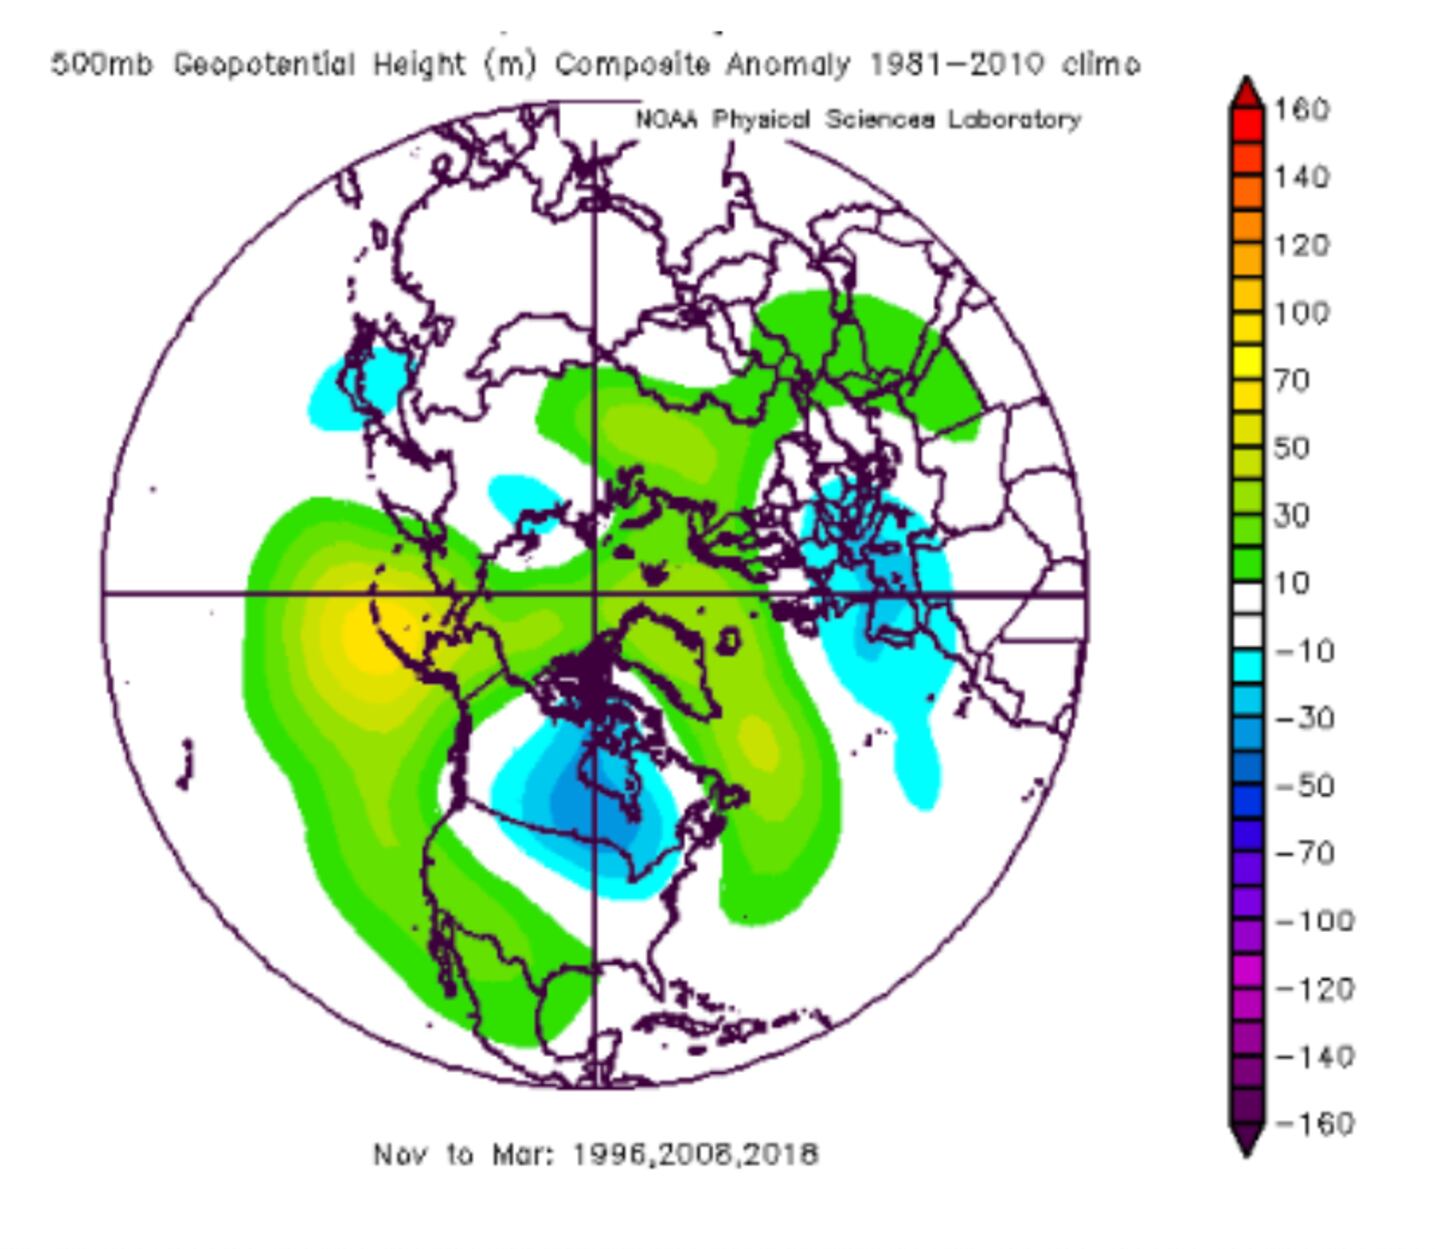
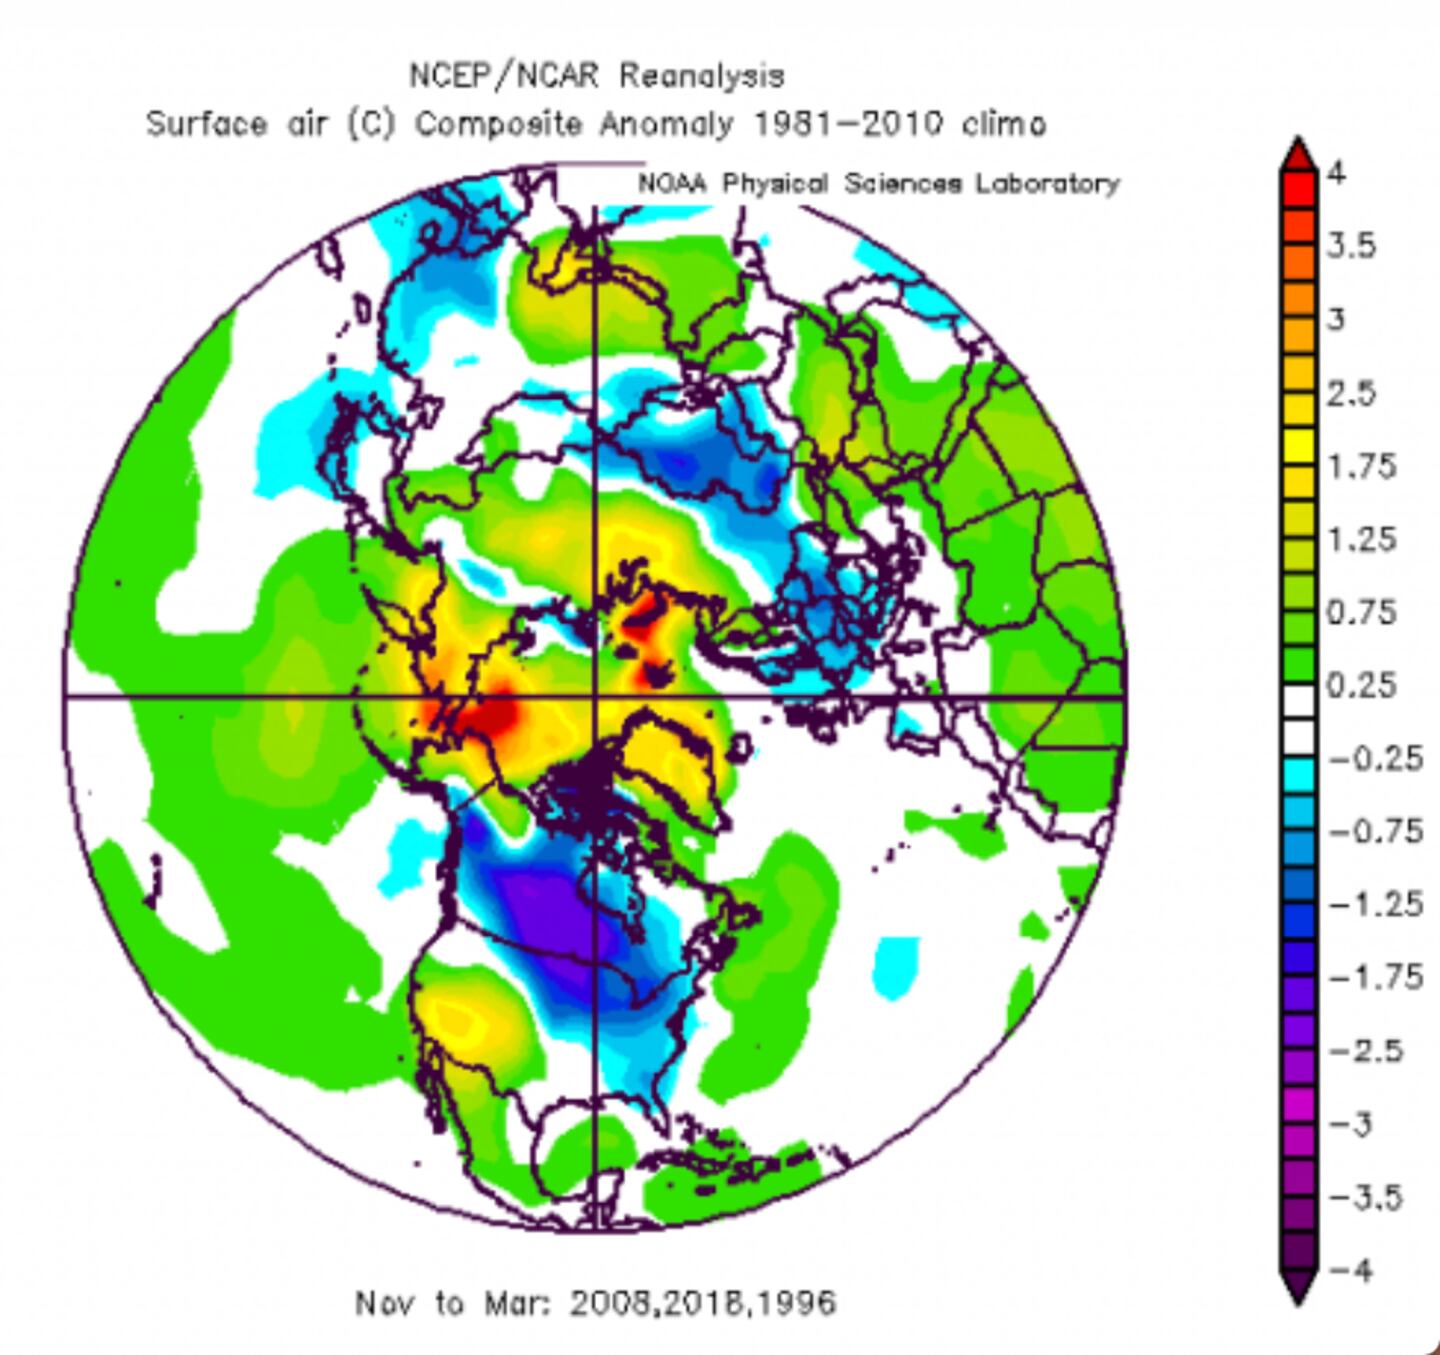
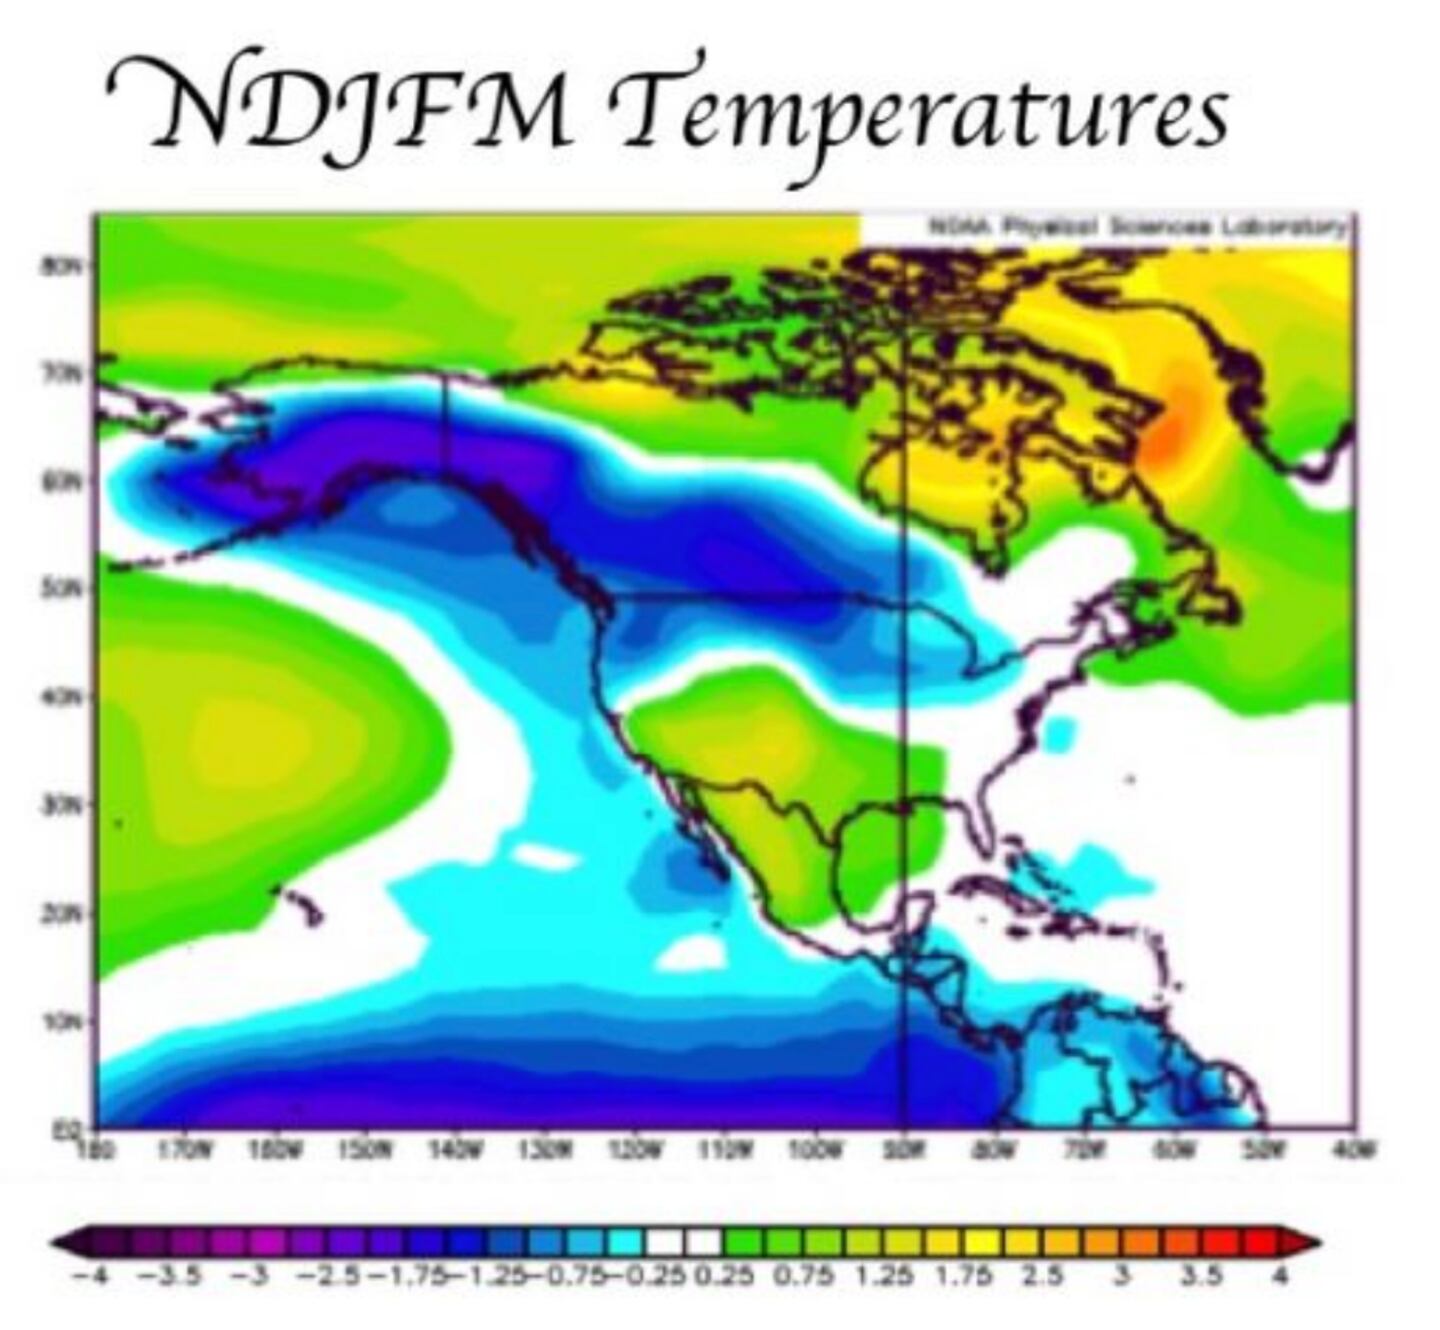
Combining all three conditions as expected this winter with high ranked model analog years produces this pattern in the past:
The surface reflection suggests the door is not shut to a cooler than typical La Nina winter, but it’s a small sample size:
But the majority of the data is more similar to a traditional La Nina outcome on surface temps:
Remember the maps above are not a forecast they just show historical relationships.
For daily weather info follow me on Twitter @MellishMeterWSB.
Cox Media Group


