
Forecasters start with the big picture and from high up in the stratosphere and work their way down to the surface weather.
There are important weather relationships between the 500mb level chart and the surface:
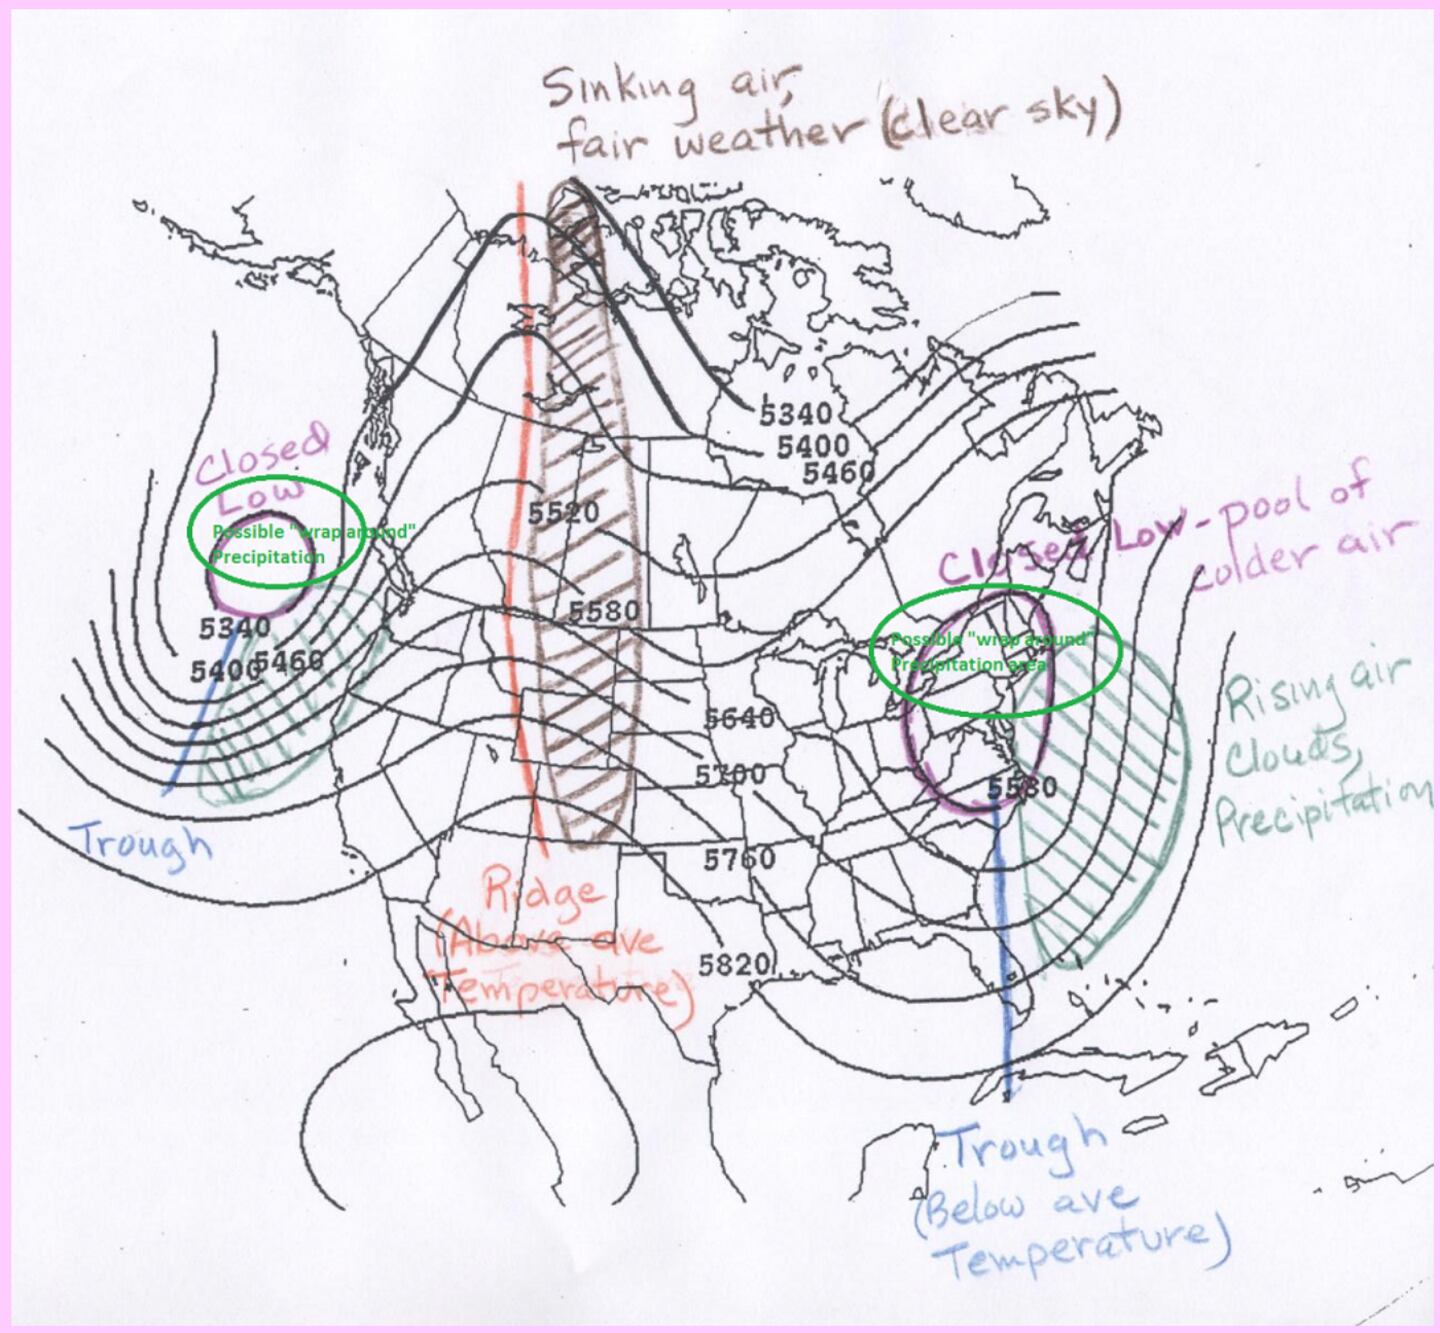
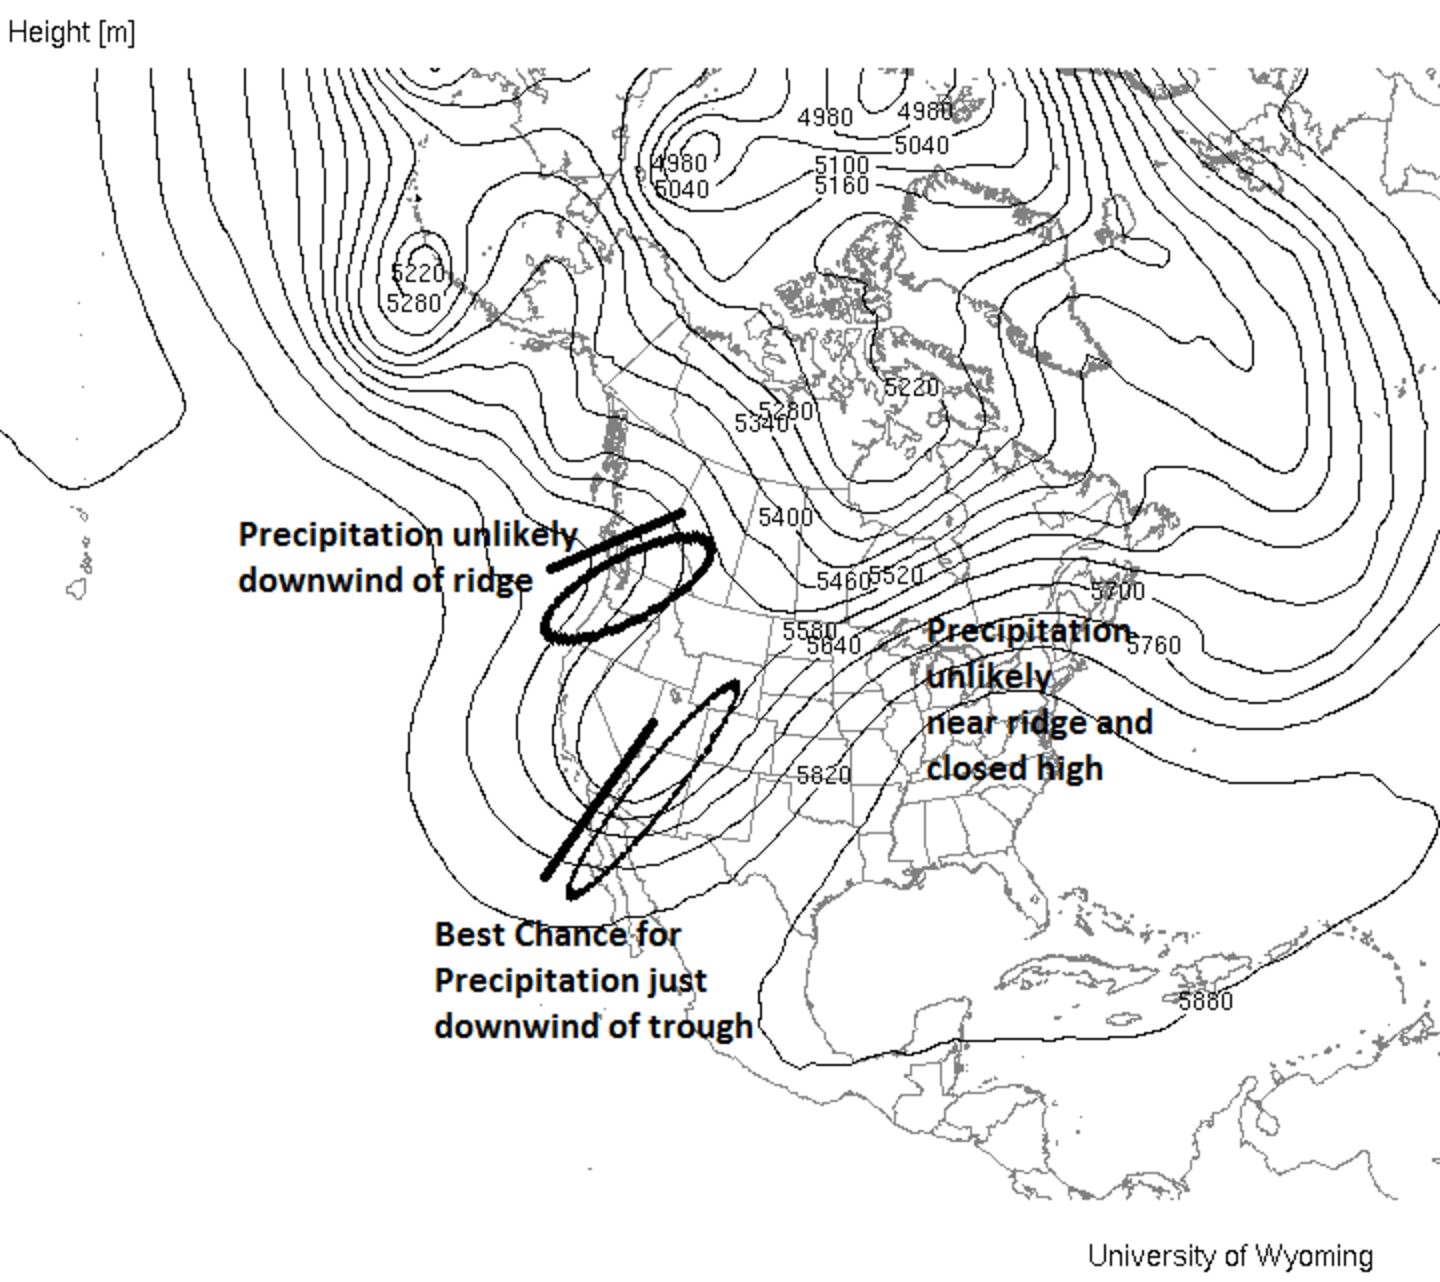
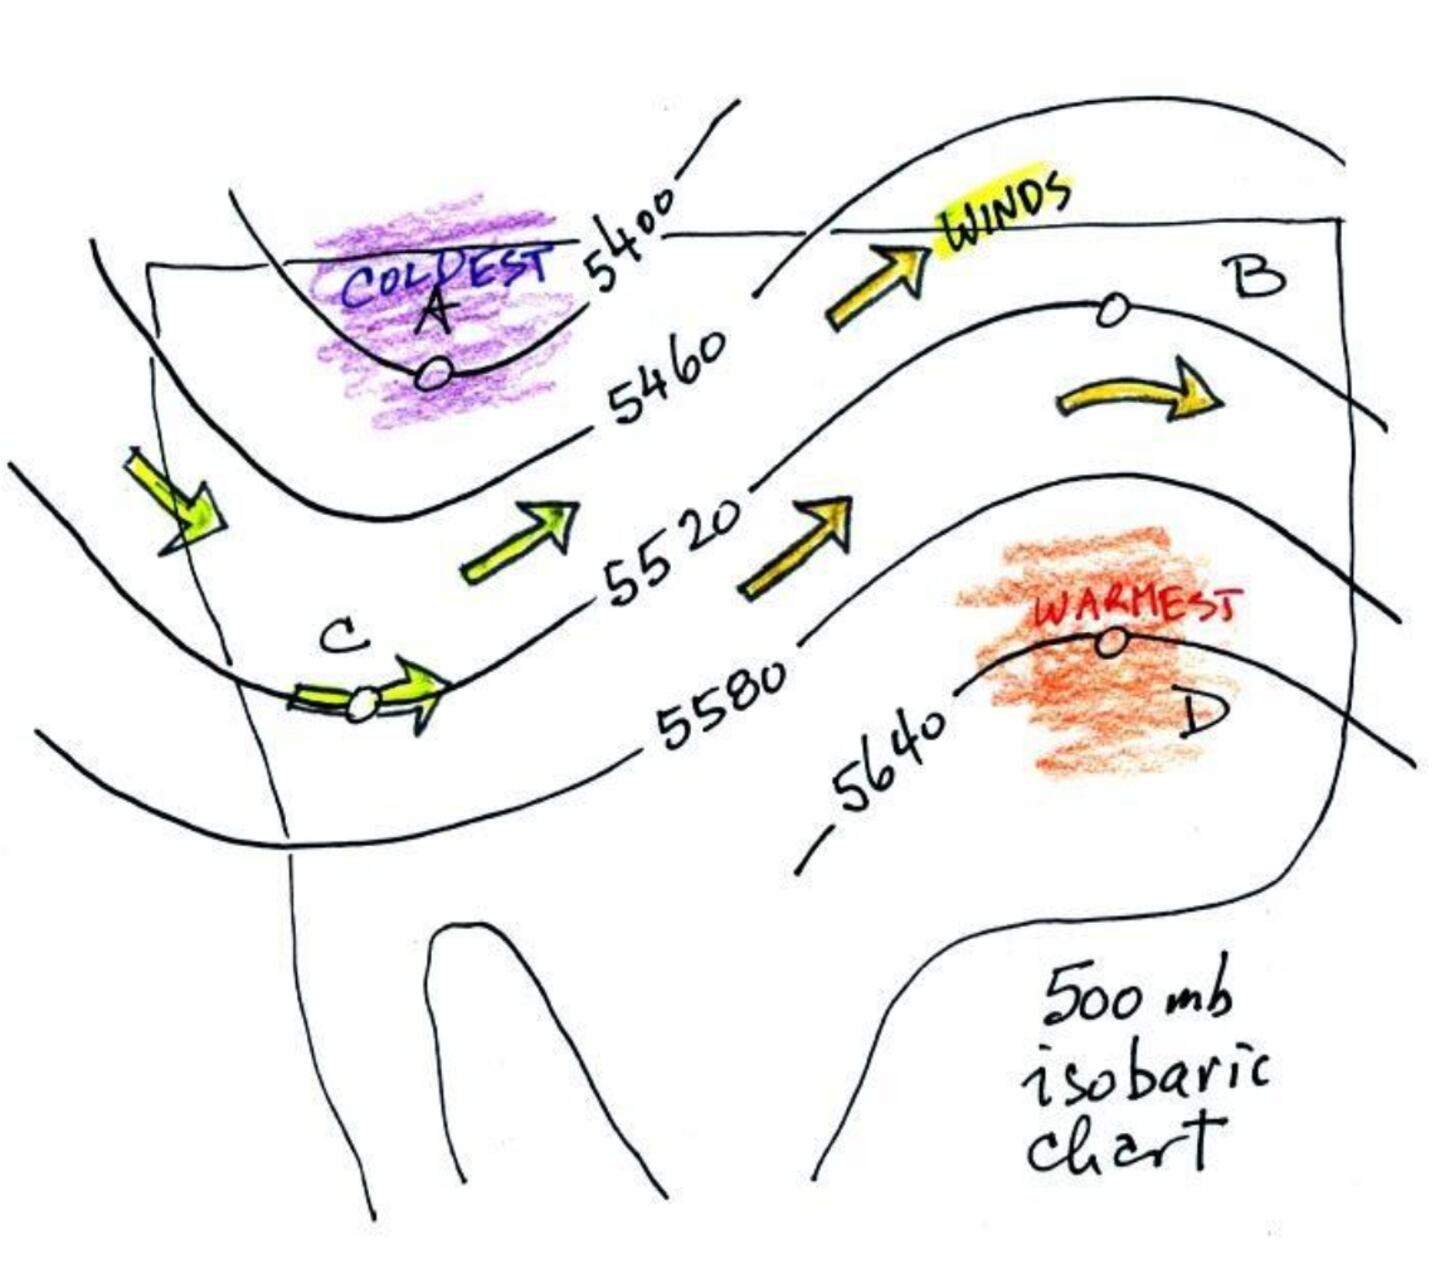
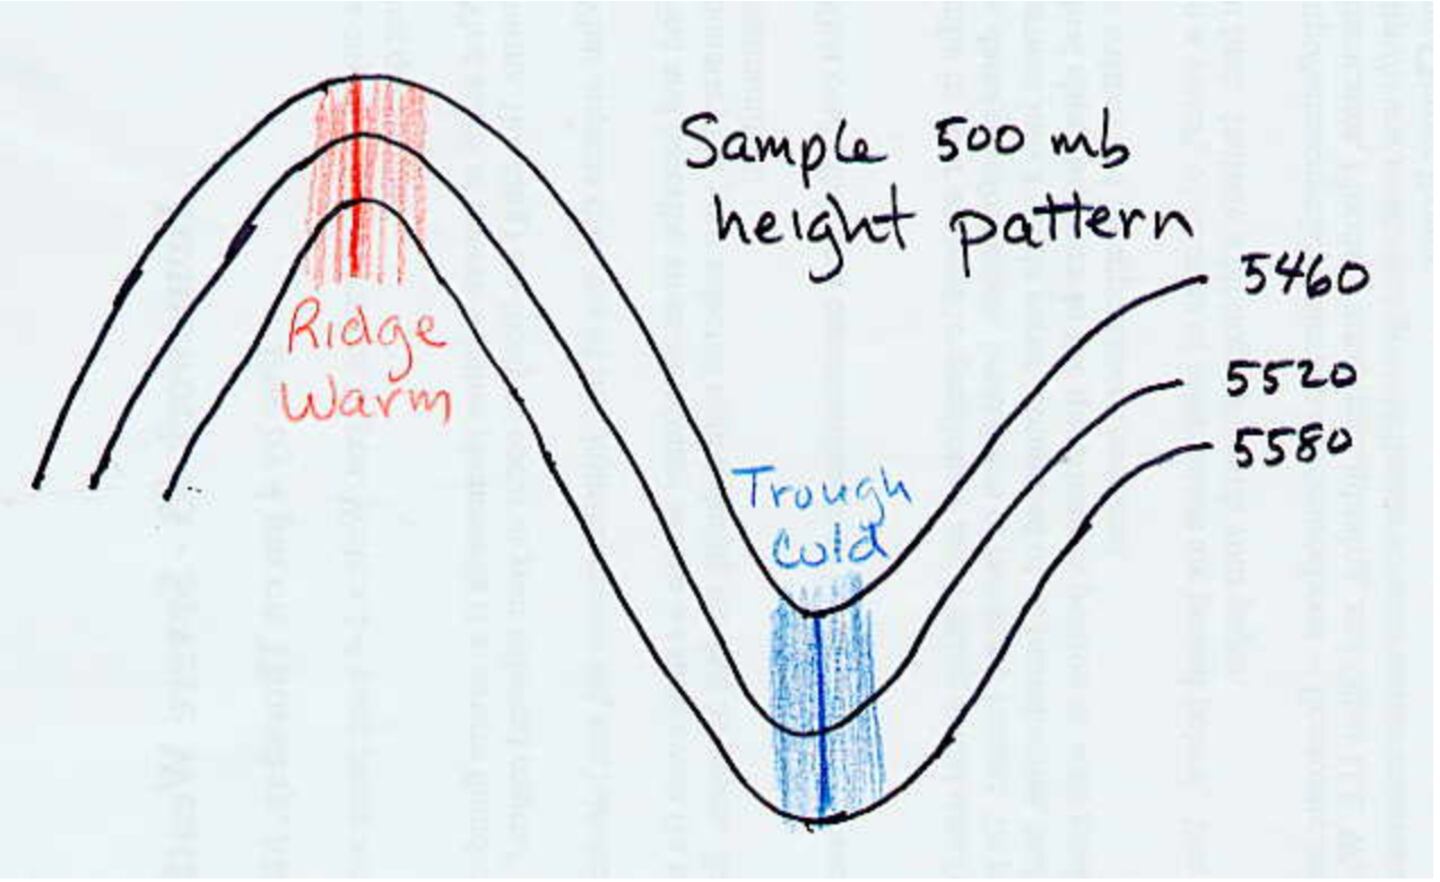
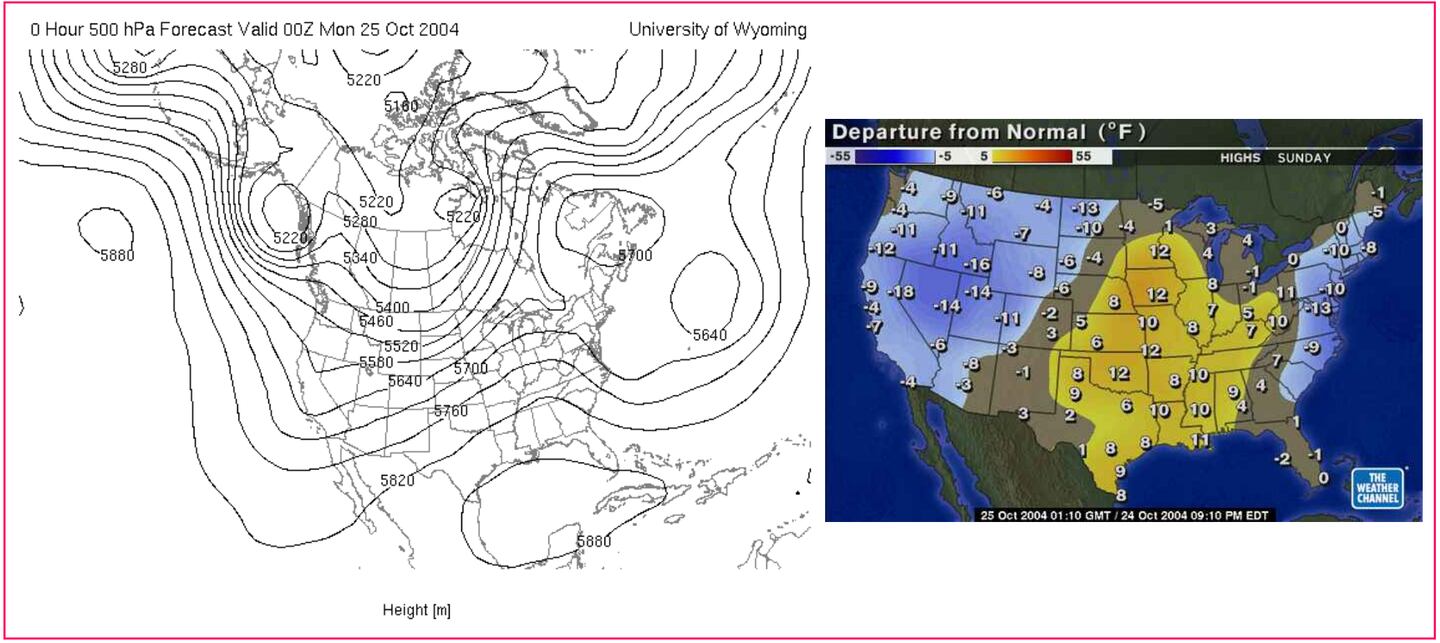
We can get a good idea of what type of air masses are located where just by looking at the 500mb chart even if computer model temperature forecast output is unavailable. Meteorologists also use it to “cross check” the models to see if their temp predictions look possible and are internally consistent before believing any model output.
The heating of the air happens as air sinks underneath the high pressure ridge causing adiabatic heating (when a gas like air is compressed it heats) this is the thermodynamics of the adiabatic process as opposed to hot air “moving in” from elsewhere, which we call “warm-air advection” (although that it happening to some extent as well).
There is an additional compressional (adiabatic) heating process that occurs to the lee (right) of the Appalachian Mountains with a N/NW air flow, this we call “downsloping” and it adds to the compressional heating from the sinking air underneath the high pressure ridge aloft. The airflow down the mountain side means it is sinking from a higher elevation to a lower elevation thus warming adiabatically as it sinks it compresses. So it’s a double dose of compressional heating for some areas to the lee of the mountains.
I can quickly give you model lookers a rule of thumb guide.
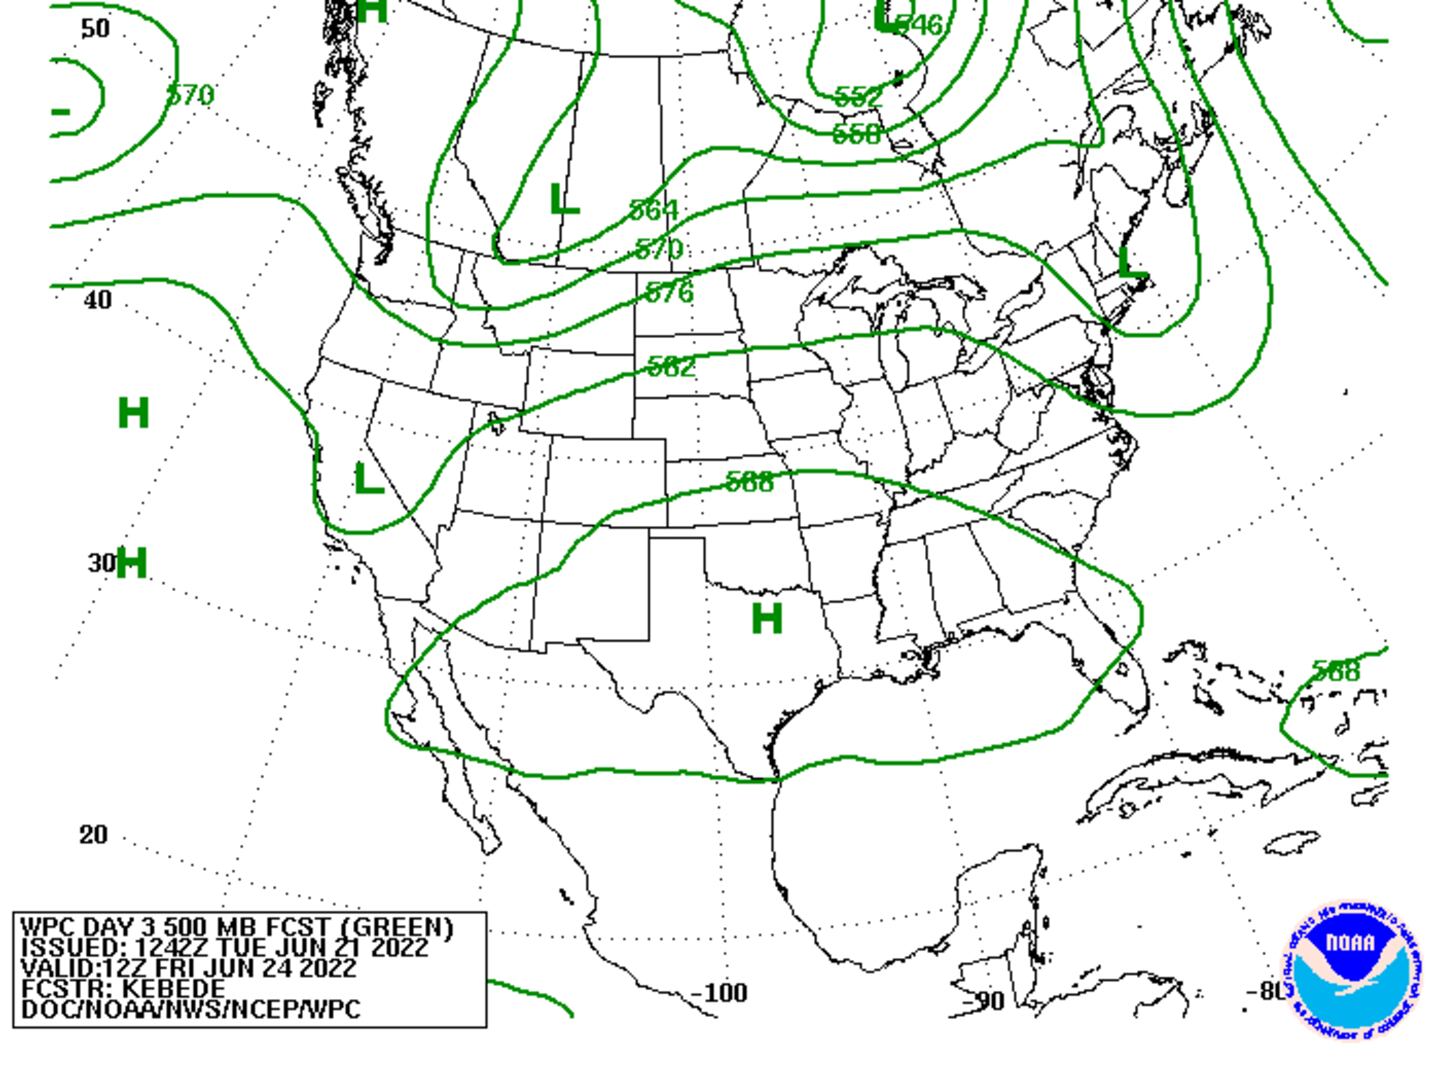
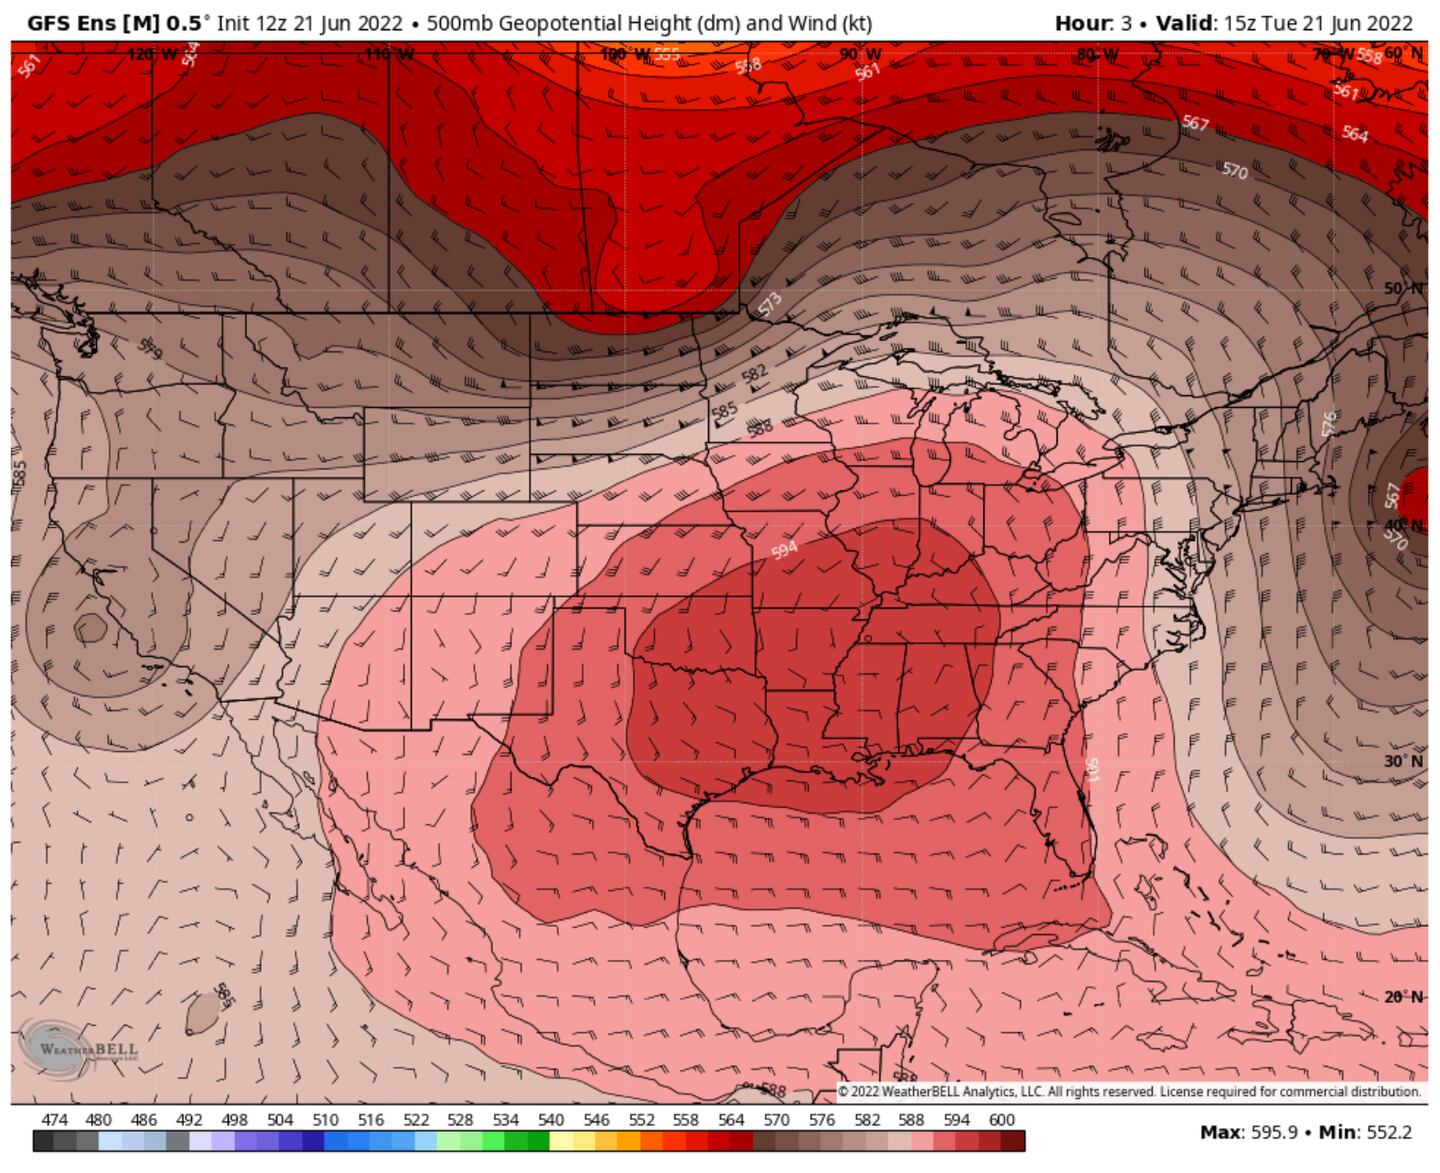
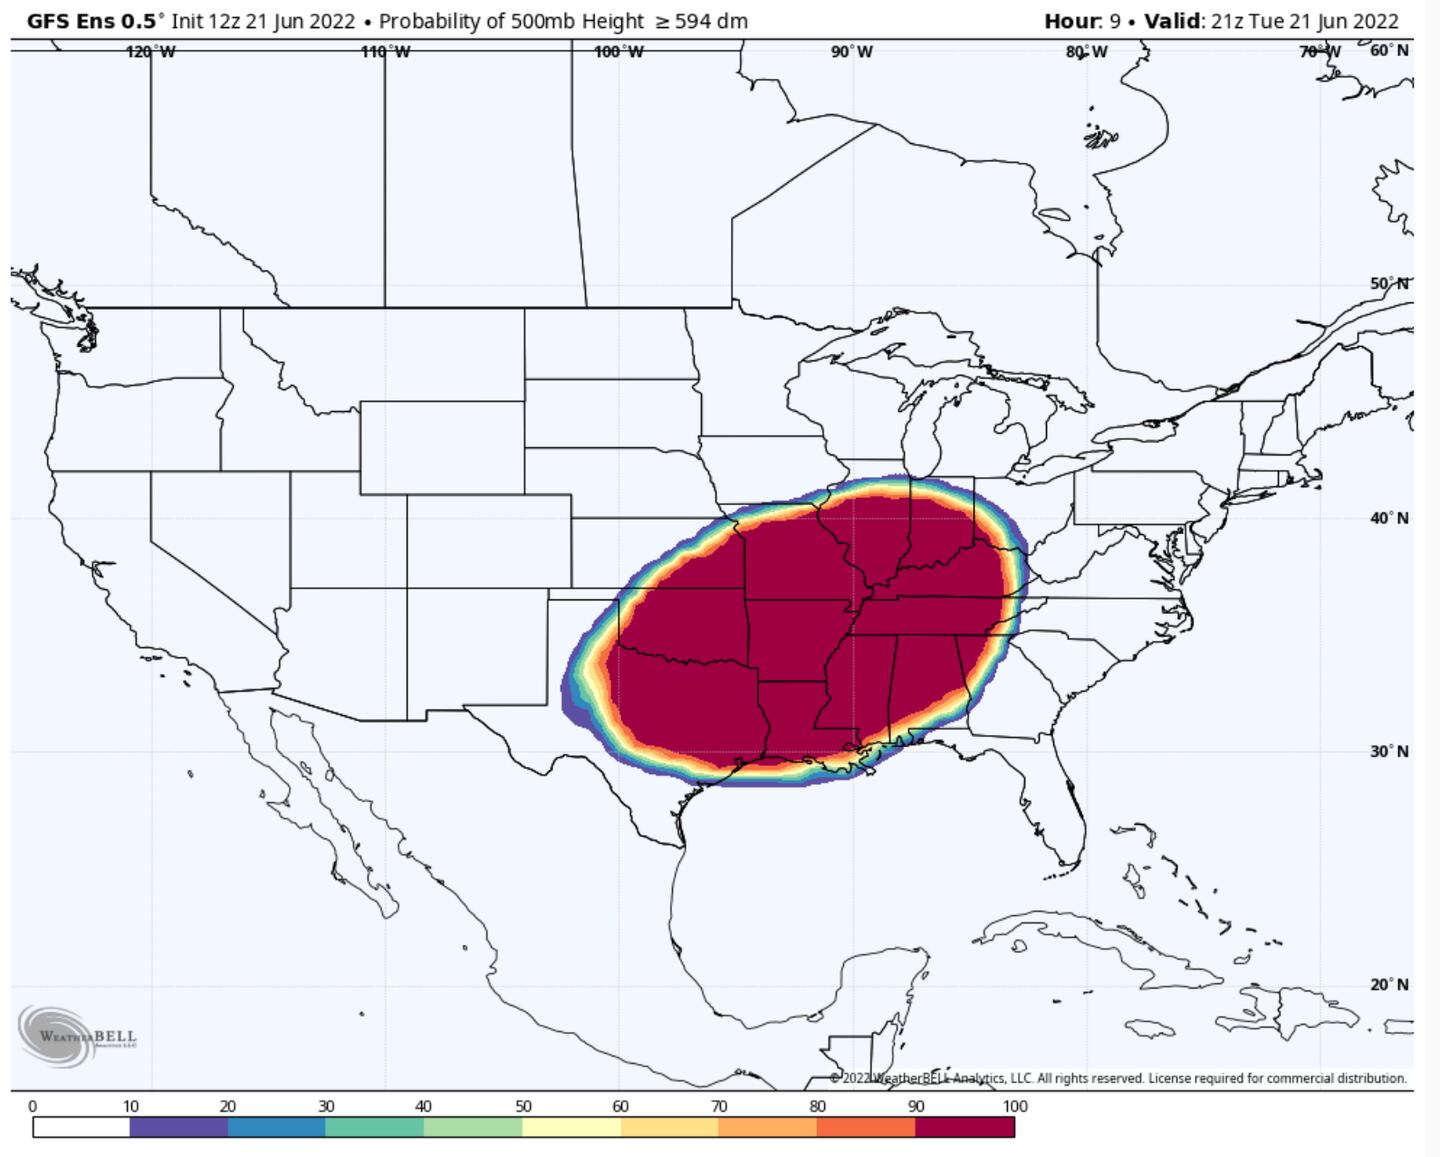
Roughly speaking the 582 line tells you where the really warm weather is getting started. Highs in the 80s. The 588 line is used to depict an upper-level “heat ridge dome” and typically depicts highs around 90ºF.
A summertime 582 500mb is common, 588 is hot even for summer, a 500mb level of 591 or above is rare even for summer.
A 500mb chart level of 594 (fairly rare) indicates mid to upper 90s possible and a 597 or above (very rare) indicates triple digits.
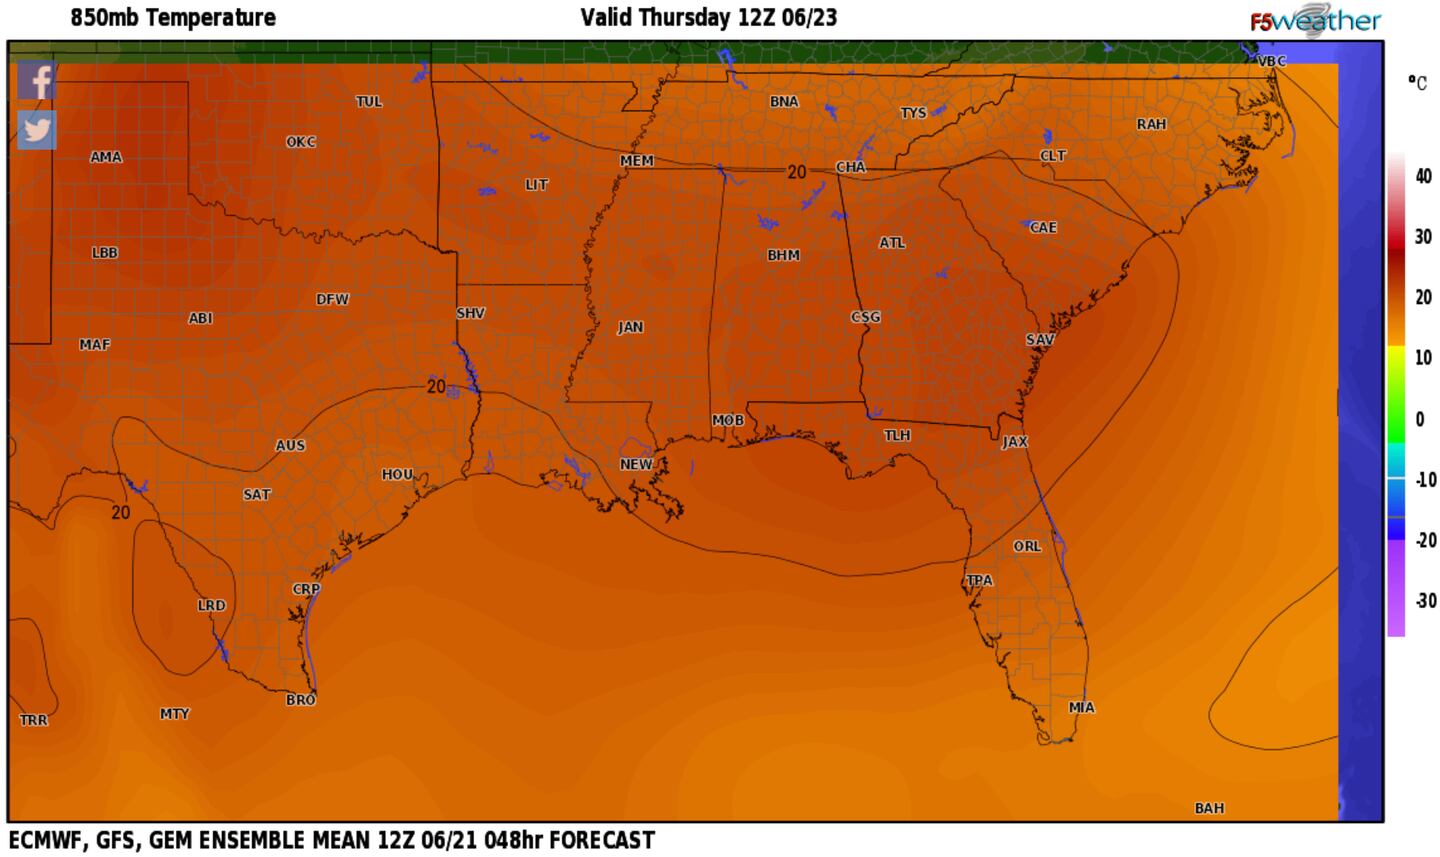
Likewise we use temperature at about 5,000 feet, the 850mb level chart to also suggest high and low temperatures at the surface and to cross check model predictions of air temperature.
Rule of thumb for high temps based on 850mb chart:
15ºC = 90ºF, 20ºC = 95ºF, 25ºC = 100ºF or above
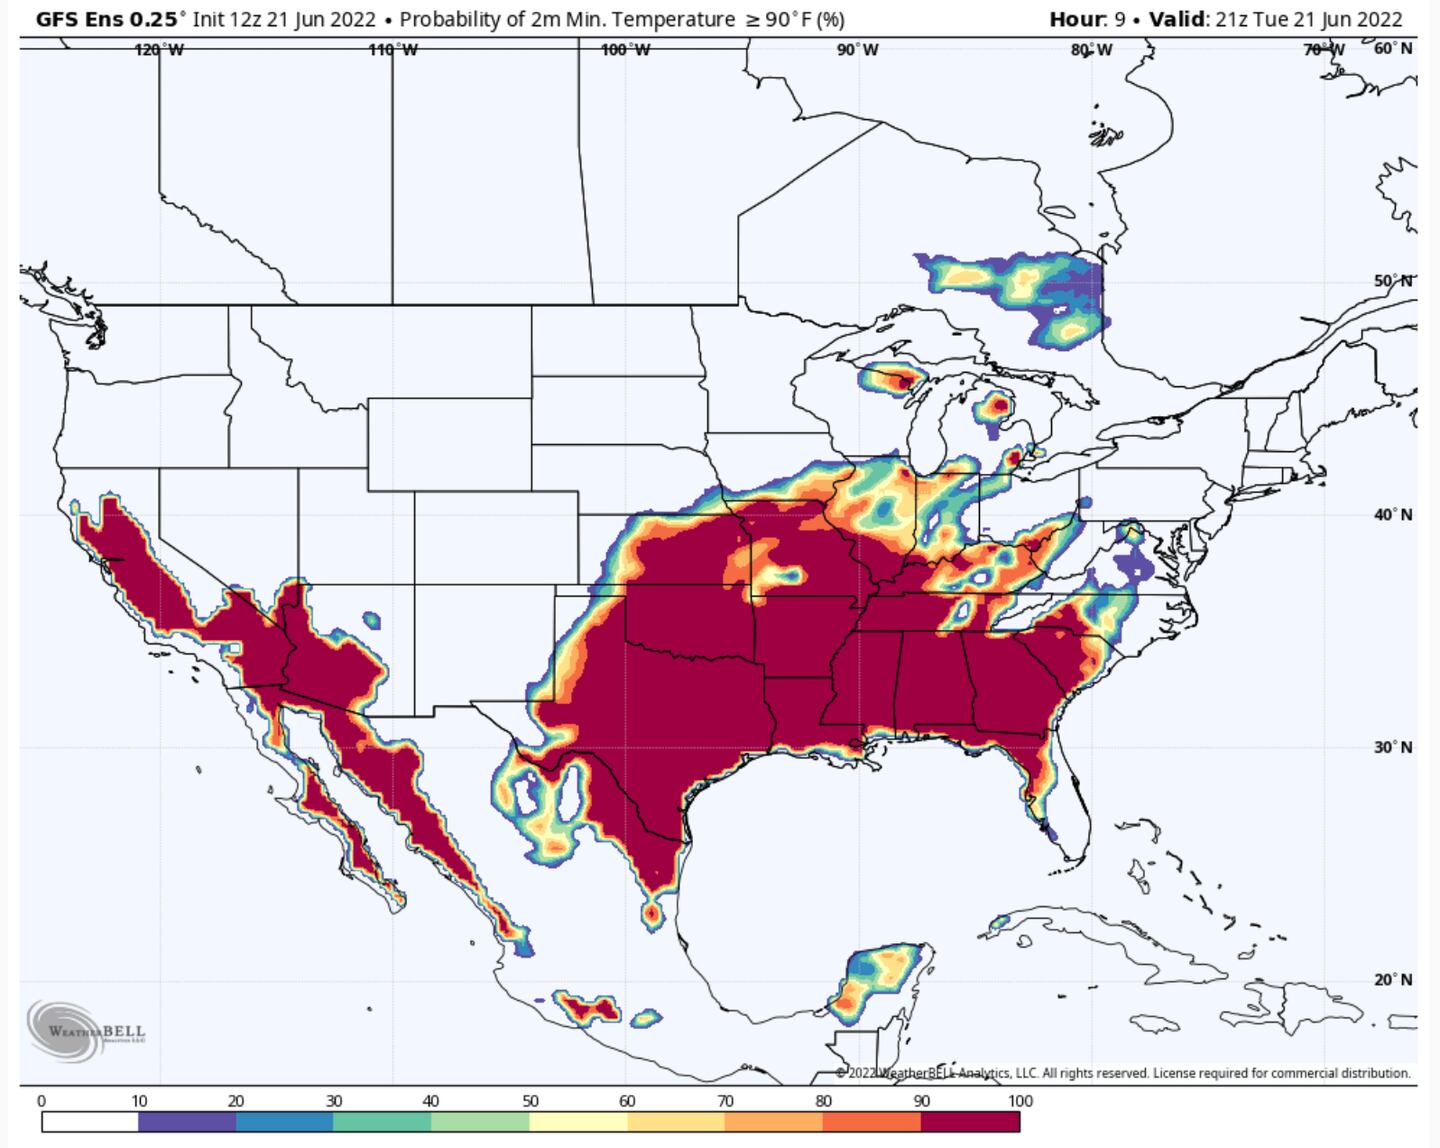
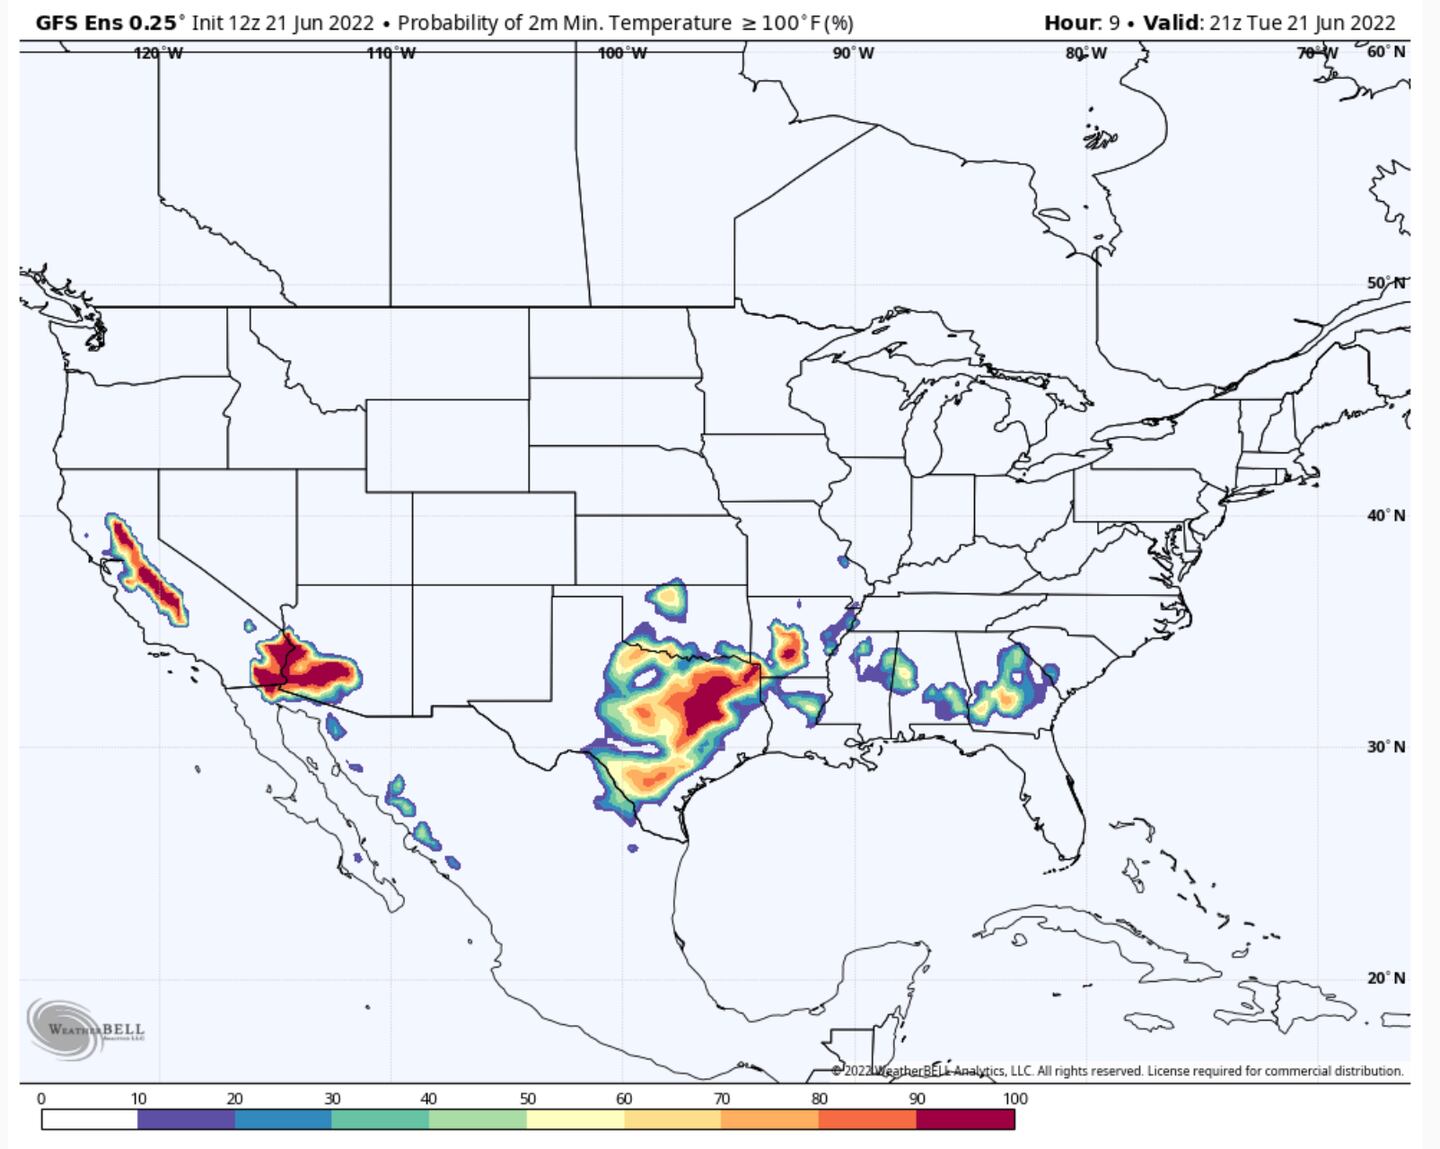
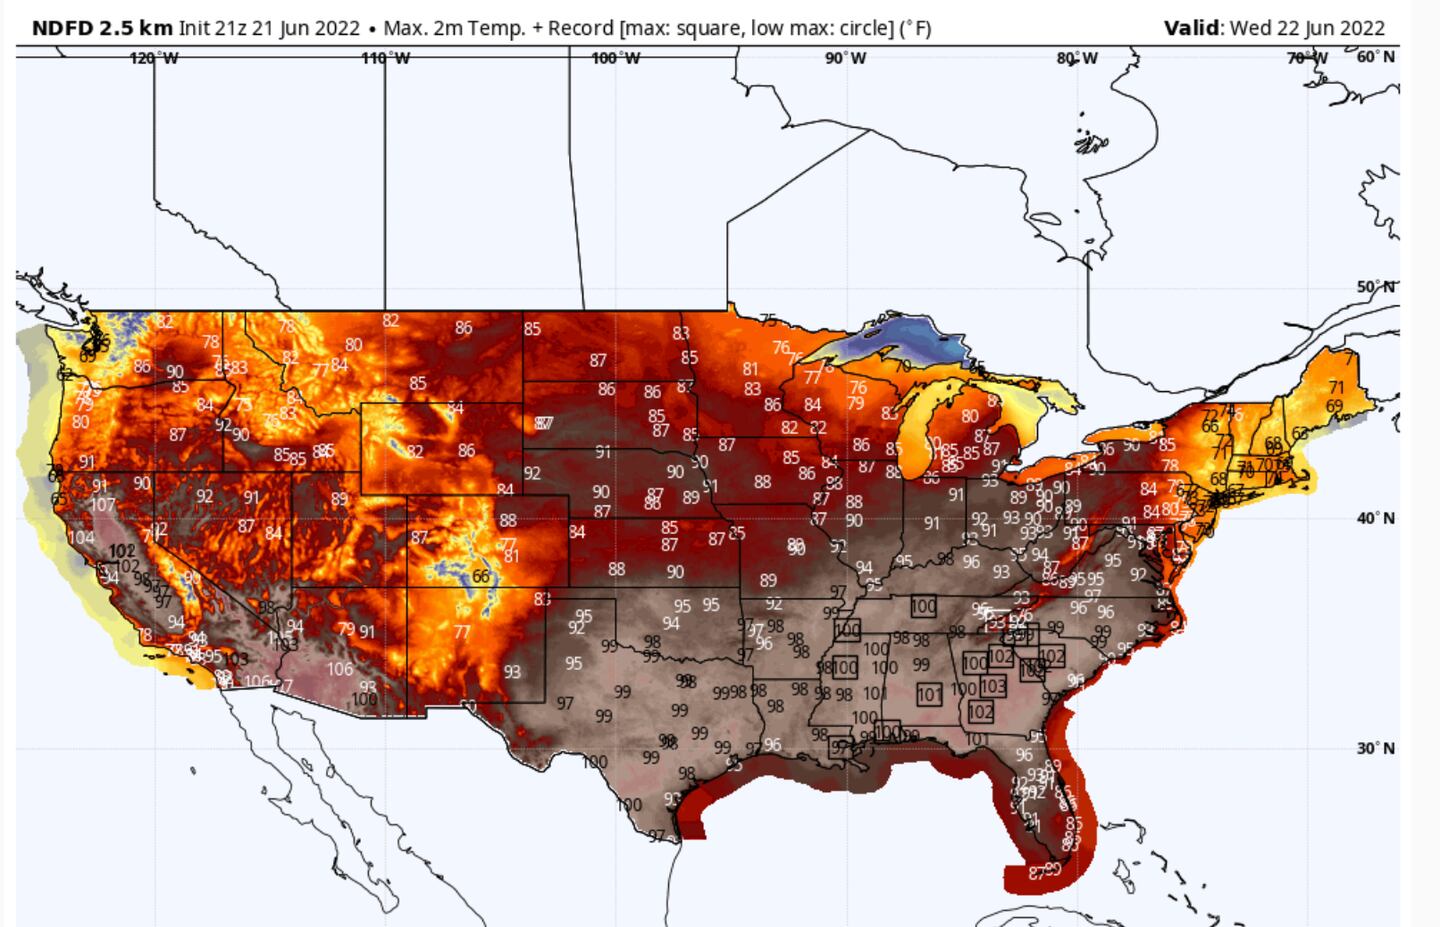
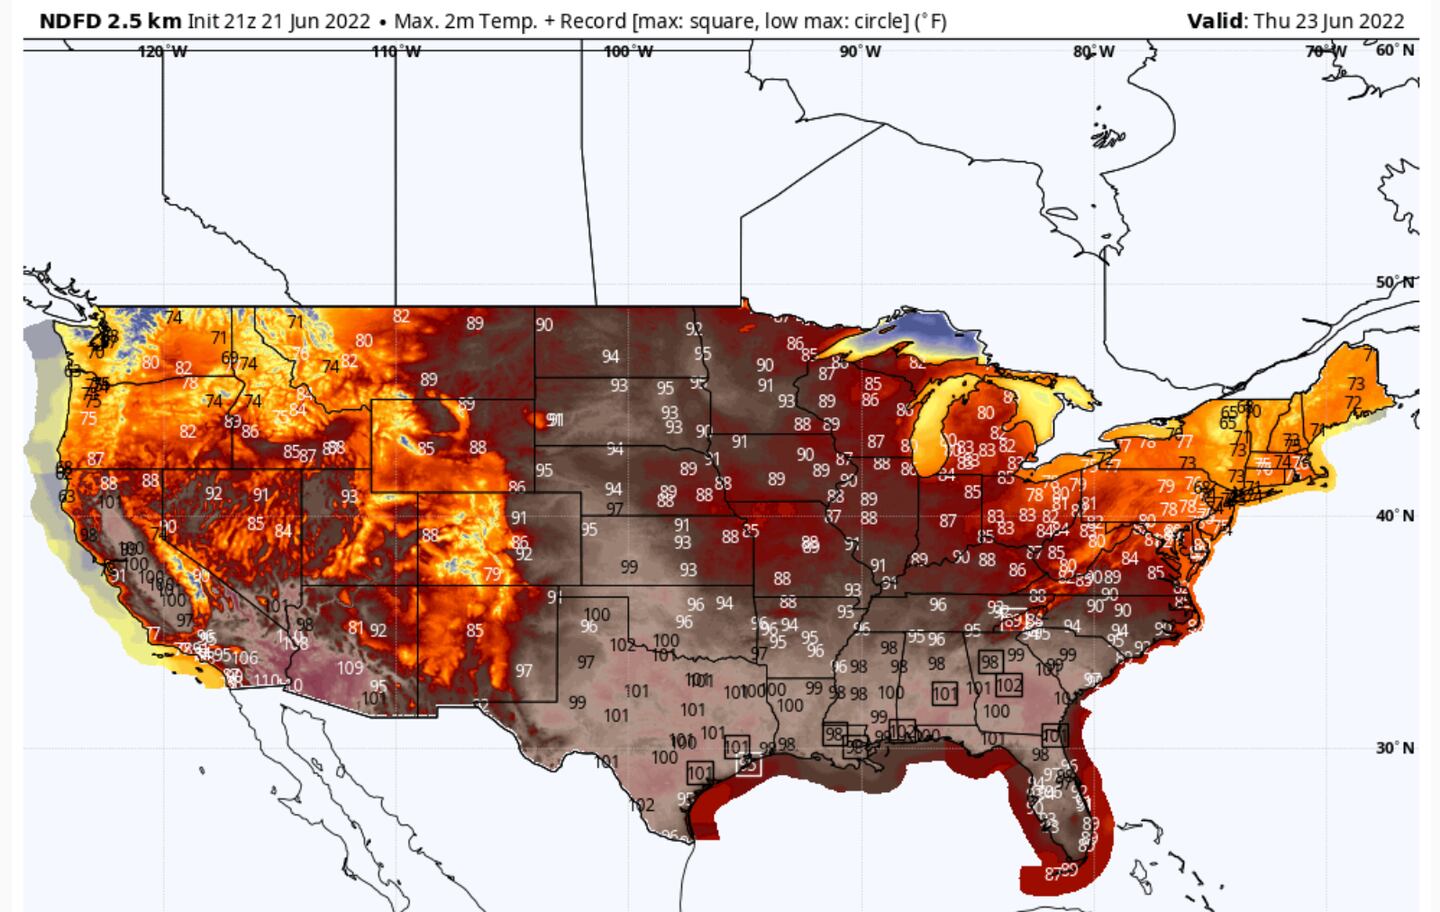
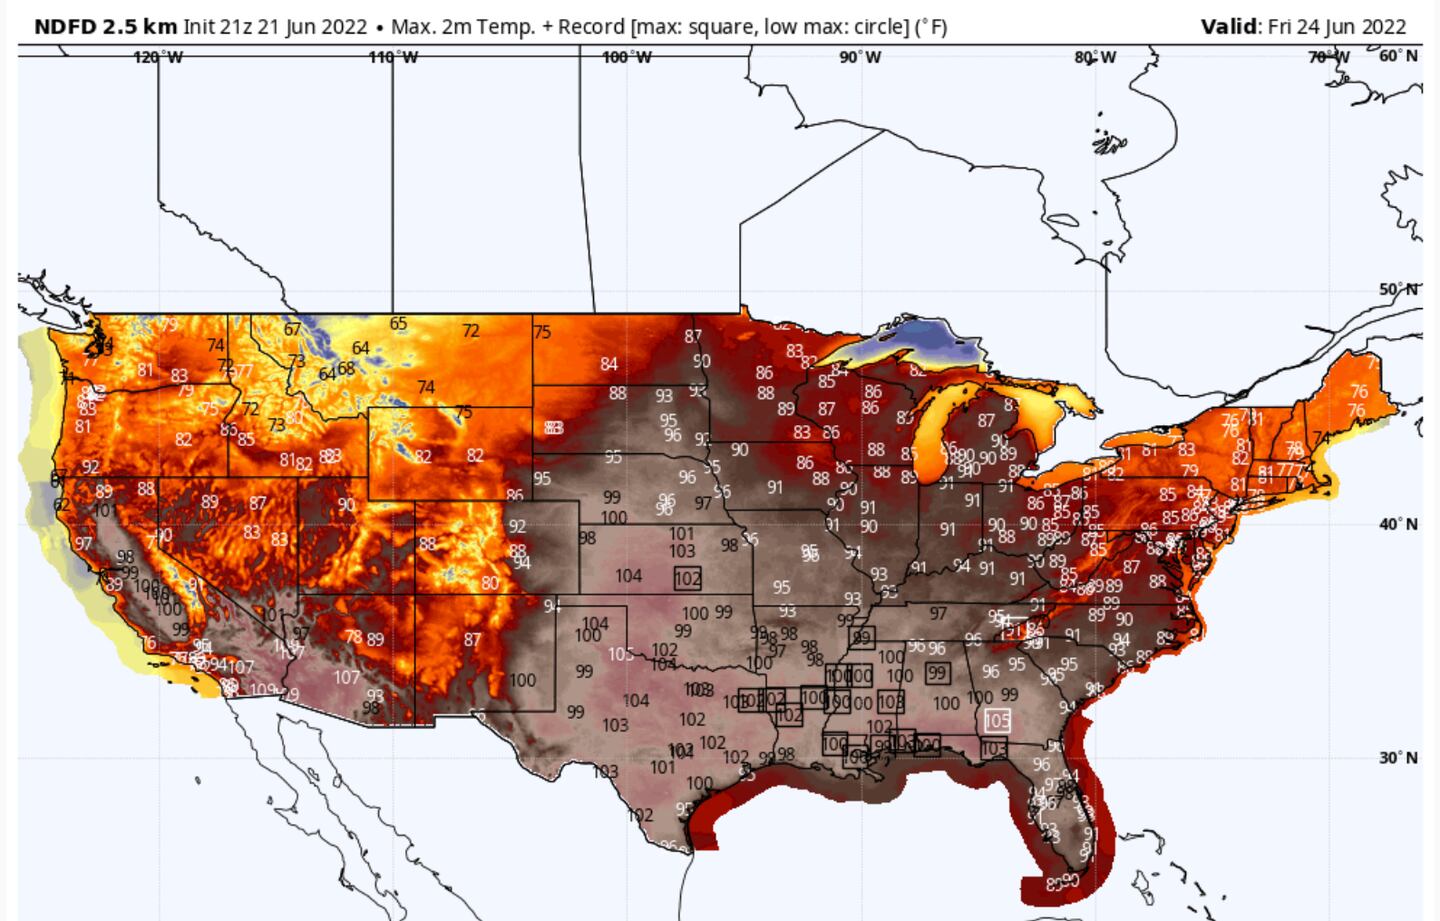
You will see the relationships between surface air temperature and 500mb height level and 850mb temperatures to heat waves in the maps below.

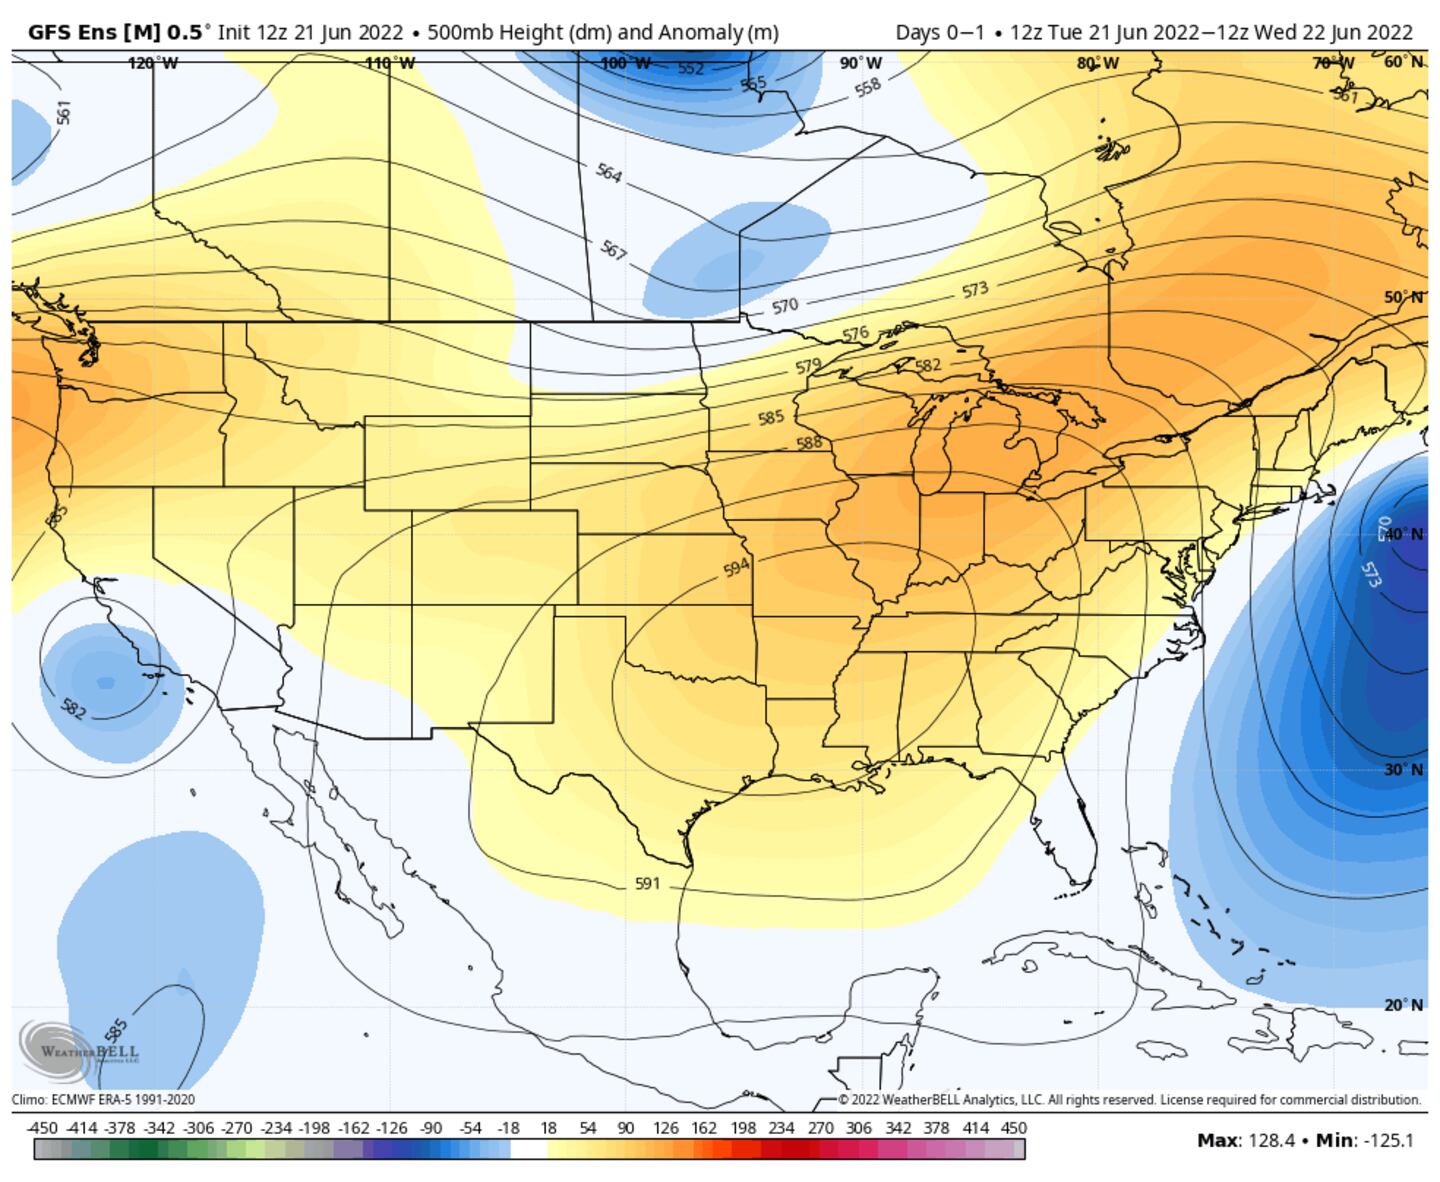
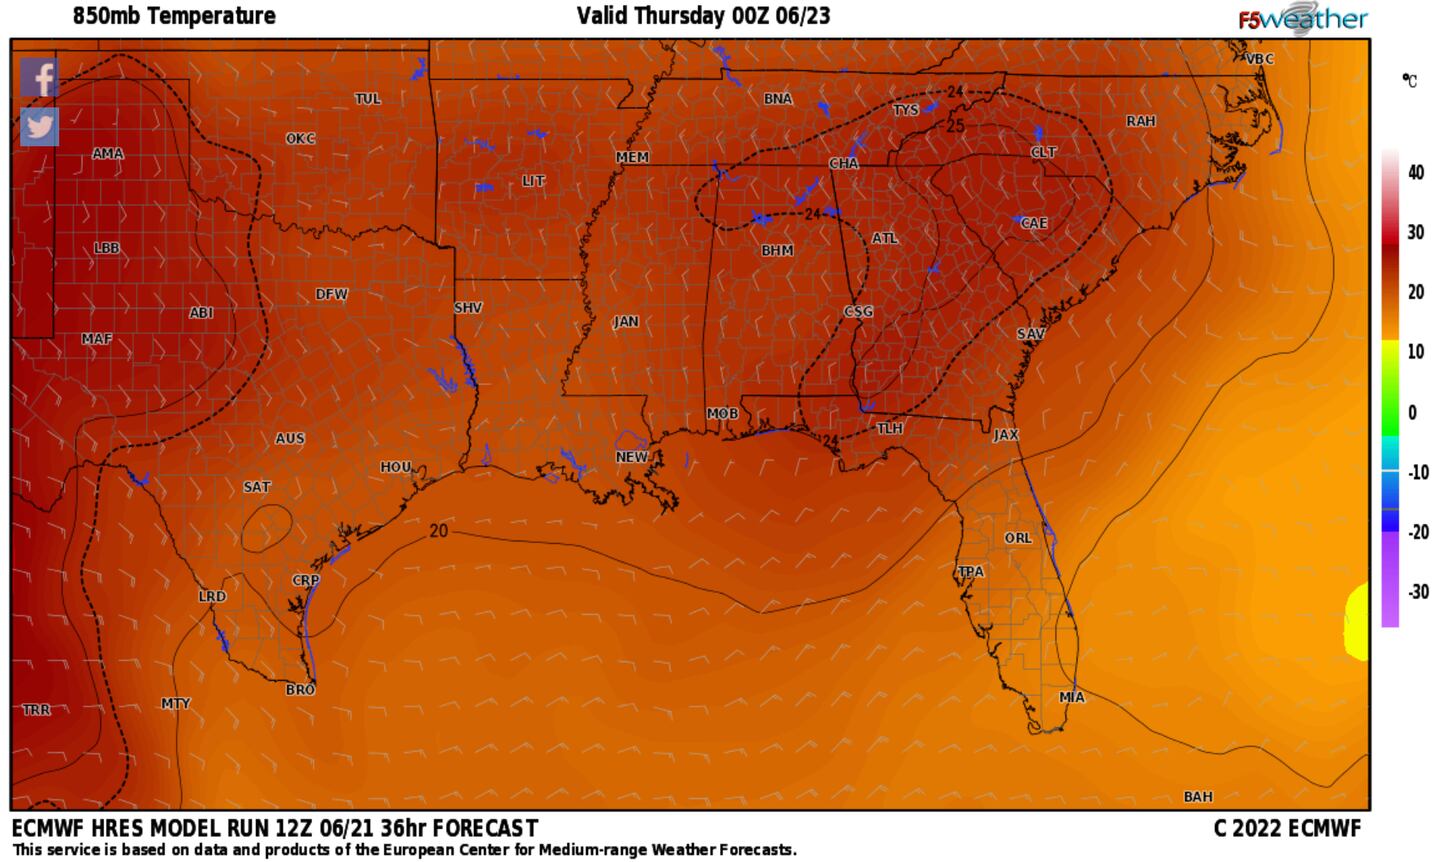
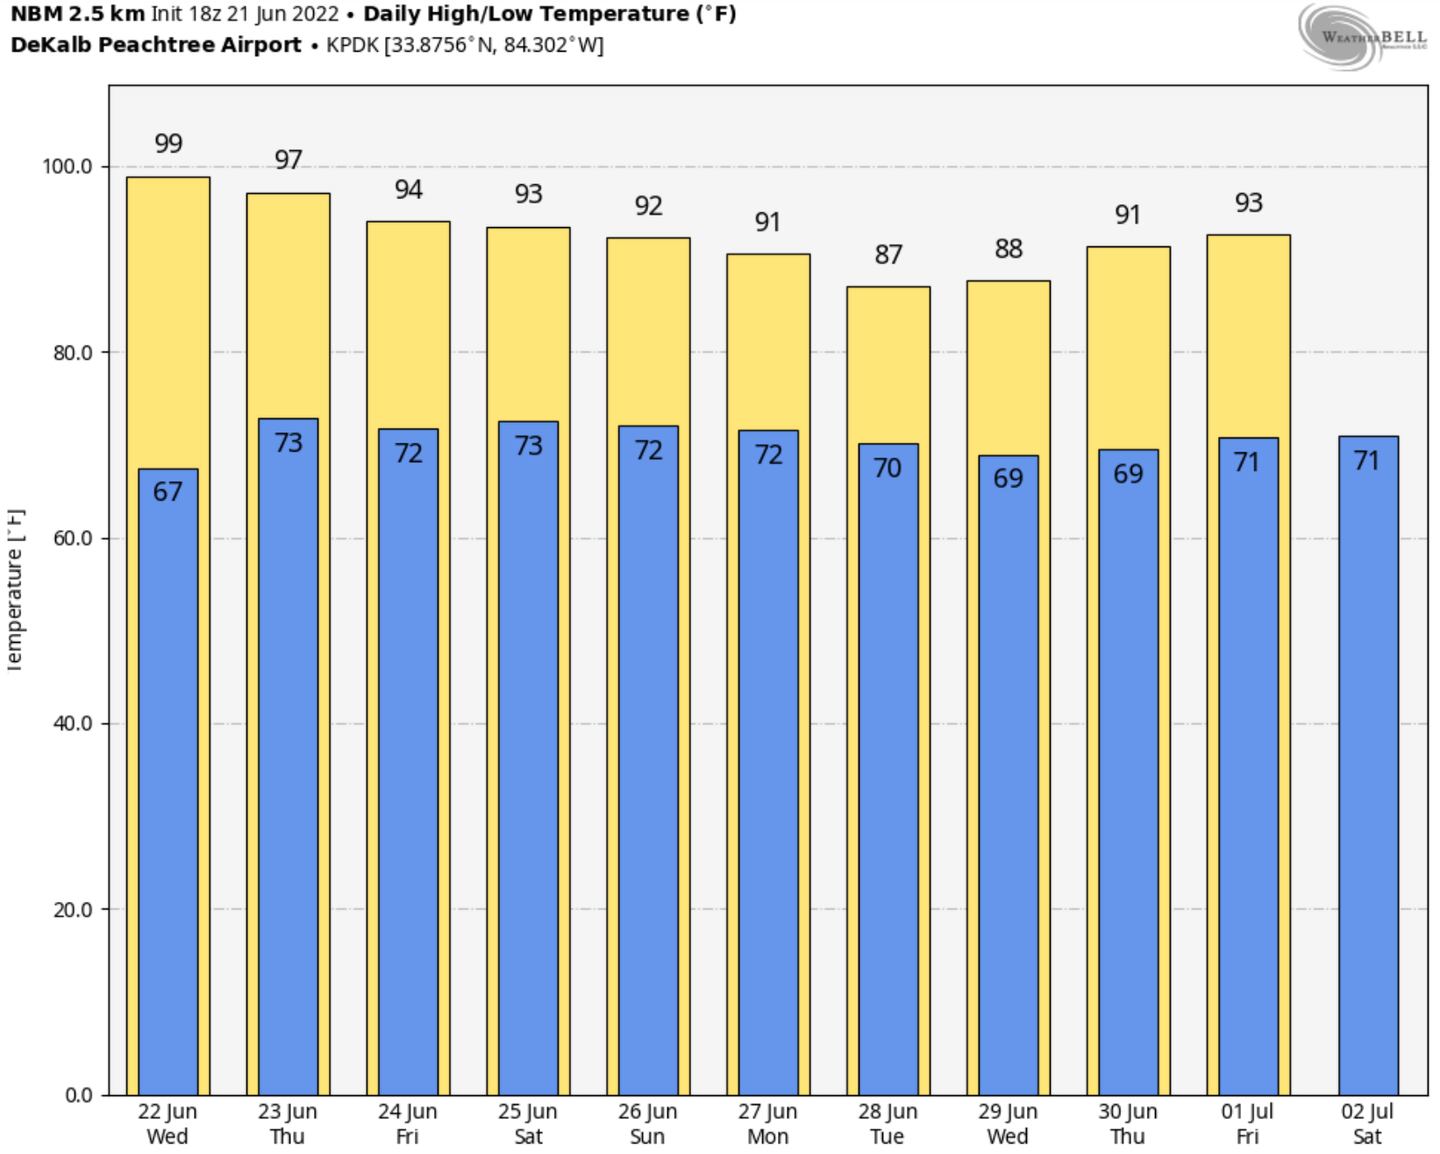
***When the 850mb temps drop and the 500mb levels drop then the surface temps will drop as well, this is expected to happen gradually over the weekend and into next week as the core of the ridge drifts North and West over time.***
For more follow me on Twitter @MellishMeterWSB.
©2022 Cox Media Group


 Sign Up


